
In 2026, the states with the most traffic accident deaths are Texas, California, Florida, North Carolina, and Georgia, based on NHTSA’s latest full-year 2025 estimates. The states with the fewest are Rhode Island, Vermont, Alaska, North Dakota, and Delaware.
Raw totals do not tell the whole safety story, though. Big states usually have more crashes because more people drive more miles.
Per-mile risk points to a different danger map: New Mexico, Mississippi, South Carolina, Arizona, and West Virginia have some of the highest estimated fatality rates per 100 million vehicle miles traveled.
For drivers, pedestrians, cyclists, parents, and commuters, the useful question is not simply “Which state has the most accidents?” It is: where is the risk highest, what type of road travel creates that risk, and what should a person check before driving there?
The Data Needs One Important Warning
“Traffic accidents” is the phrase most people search, but federal safety agencies usually use “traffic crashes.” That wording matters because a crash is measurable. It can be reported, investigated, counted, and compared.
Complete 2026 crash data is not available yet. Traffic fatality records are usually finalized after a delay because agencies need police reports, death records, vehicle data, location details, and state reporting updates. NHTSA’s current 2026 picture relies mainly on the final 2024 data and the projected 2025 data.
There is another limitation. Total crash counts across states can be messy because nonfatal crashes depend on state reporting thresholds, police practices, property damage rules, and local publication schedules.
Fatal crash data is more consistent because NHTSA’s Fatality Analysis Reporting System counts fatal crashes across the 50 states, D.C., and Puerto Rico when at least 1 person dies within 30 days of a traffic crash.
That makes fatality totals and fatality rates the cleanest national comparison for a 2026 state ranking.
NHTSA estimated 36,640 traffic deaths nationwide in 2025, down from 39,254 in 2024. The estimated U.S. fatality rate also fell from 1.19 to 1.10 deaths per 100 million vehicle miles traveled.
The highest raw totals still cluster in large, heavily traveled states.
A person planning a move, road trip, delivery route, or insurance budget should not read that table as “Texas is the most dangerous state to drive in.”
It means Texas had the highest estimated death count. A rate-based comparison answers a different question.
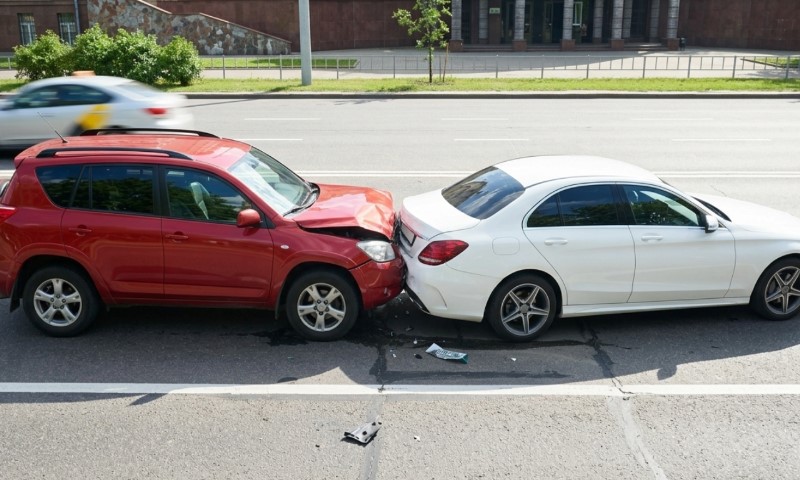
A third question also matters for people involved in a crash: what type of vehicle caused the harm?
A multivehicle truck crash in California can raise different evidence and liability issues than a minor passenger-car collision, which is why local resources such as Bakersfield Truck Accident Lawyers may be relevant for readers dealing with commercial-vehicle cases.
Small states usually have fewer traffic deaths because fewer people drive fewer total miles. That does not make every road safe, but it does explain why the lowest raw totals look very different from the high-total list.
Washington, D.C. had an estimated 25 fatalities in 2025, lower than every state, but it should not be grouped with states in a state ranking. Its road network, land area, commuting pattern, and transit use are different.
The Per-Mile Risk Ranking Changes The Story
Vehicle miles traveled, usually shortened to VMT, gives a better view of crash risk per mile. A state can have fewer deaths than Texas or California but still be more dangerous for each mile driven.
For 2025, the highest estimated fatality rates include New Mexico at 1.59, Mississippi at 1.52, South Carolina at 1.51, Arizona at 1.50, and West Virginia at 1.46 deaths per 100 million VMT.
The lowest estimated rates include Rhode Island at 0.47, Massachusetts at 0.57, Minnesota at 0.62, New Jersey at 0.74, and Utah at 0.75.
That difference matters in real life. A family driving across Arizona, New Mexico, or South Carolina may face more per-mile fatality risk than someone commuting in a large state with a lower rate. The route, time of day, road type, and driver behavior still matter more than a state label.
Why 2026 Still Requires Caution Despite Better National Numbers
The national trend is improving, but the numbers remain high. NHTSA estimated 6.18 million police-reported traffic crashes in 2024, along with 2.42 million injuries and 39,254 deaths, according to its 2024 crash overview.
Fatal traffic crashes fell from 37,769 in 2023 to 36,297 in 2024, but nonfatal crashes still represented a massive public safety burden.
The 2025 estimate of 36,640 deaths would bring fatalities closer to 2019 levels, but that still means around 100 people dying on U.S. roads on an average day.
Alcohol also remains a major factor. In 2024, NHTSA reported that alcohol-impaired-driving crashes accounted for 30% of traffic fatalities nationwide.
Night driving deserves special caution too. In 2024, nighttime fatalities from 6 p.m. to 5:59 a.m. totaled 20,971, compared with 18,017 daytime fatalities. Weekend fatalities also remained heavy, with 16,128 deaths from Friday evening through early Monday morning.
A Safer Way To Read Any State Ranking
A ranking is useful only if it changes a decision.
Before a long drive, especially through a high-rate state, check the risk in practical terms:
- Will the trip force several hours of night driving?
- Are you crossing rural highways with long gaps between services?
- Is the route popular with freight traffic or vacation traffic?
- Will weather make stopping distance longer?
- Is there a sober plan for every driver in the group?
- Are pedestrians, cyclists, or motorcycles common along the route?
For parents, the useful step may be setting a no-phone driving rule for teen drivers. For older adults, it may be avoiding unfamiliar rural roads after dark. For motorcyclists, it may be treating high-speed state highways differently from city commuting.
For employers, especially companies with sales staff, service vehicles, or delivery drivers, state rankings should inform route planning, training, and crash reporting procedures. A business that sends drivers through several high-rate states should treat road safety as an operating risk, not an afterthought.
The Common Misread: “Low Fatalities” Does Not Always Mean “Safe”

A low fatality count can hide per-mile danger. Delaware, Wyoming, Hawaii, and South Dakota all had low estimated fatality counts in 2025, but their fatality rates were above 1.15 deaths per 100 million VMT.
That does not mean those states are unsafe everywhere. It means raw totals alone can give drivers false confidence.
The best comparison uses 2 questions at the same time:
- How many people are dying in traffic crashes?
- How much risk exists for each mile driven?
Large states dominate the first question. Smaller or more rural states can stand out on the second.
Final Takeaway
The states with the most traffic accident deaths in 2026 reporting are Texas, California, Florida, North Carolina, and Georgia, using NHTSA’s latest 2025 estimates.
The fewest are Rhode Island, Vermont, Alaska, North Dakota, and Delaware. For actual driving risk, look beyond raw totals. New Mexico, Mississippi, South Carolina, Arizona, and West Virginia deserve close attention because their estimated fatality rates are among the highest.
Safer planning starts with the route, the hour, the road type, the driver, and the decision to avoid impaired or distracted driving.