
By a California-based travel and civic-affairs writer
The honest version, before we start
I’ve lived in California for 16 years. I’ve slept on a futon in the Mission, woken up to fog horns in Pacific Grove, watched the sun go down over the Salton Sea from a friend’s porch in Indio, and once spent a January doing tax season out of a co-working space in Redding because the rent was a third of San Francisco’s.
I’m an out queer person, my chosen family is scattered across this state, and I have texted approximately 40 of them in the last two weeks to put this guide together.
So here’s what this is and isn’t.
This is a deeply researched, locally informed guide to the safest cities in California in 2026 – built from FBI Crime Data Explorer numbers, California DOJ OpenJustice datasets, the Public Policy Institute of California, the California Attorney General’s annual hate-crime report, the HRC Municipal Equality Index, the Williams Institute at UCLA School of Law, and a lot of phone calls.
It includes a candid LGBTQ+ angle for every city, because “safe” doesn’t mean the same thing to a trans teenager in 2026 that it does to a real-estate agent quoting violent-crime stats.
It is not a real-estate listicle, a tourism puff piece, or a “Top 10 Best Places to Live!!” SEO factory. I have tried to write it the way I’d talk to a friend who just got a California job offer and is nervous. If something here saves you a bad move or a wasted trip, that’s the win.
Let’s go.
So, what is the answer?
What is the safest city in California in 2026? By the combination of low violent and property crime per capita, strong municipal LGBTQ+ protections, and consistent rankings across multiple data sources, Irvine is widely considered the safest large city in California, regularly appearing in the FBI’s top tier of safest U.S. cities with populations over 250,000.
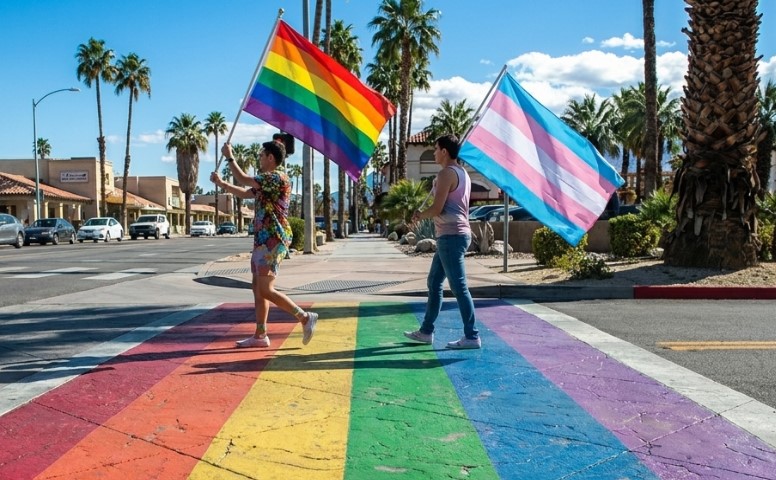
For LGBTQ+ residents specifically, West Hollywood and Palm Springs offer the strongest combination of legal scaffolding, community density, and lived social safety, both with HRC MEI scores of 100.
The strongest overall picks in this guide are Irvine, Mission Viejo, Palm Springs, Encinitas, and Carlsbad, depending on whether you prioritize crime data, LGBTQ+ safety, family life, coastal access, or cost of living.
Quick-reference table: 22 safest California cities for 2026
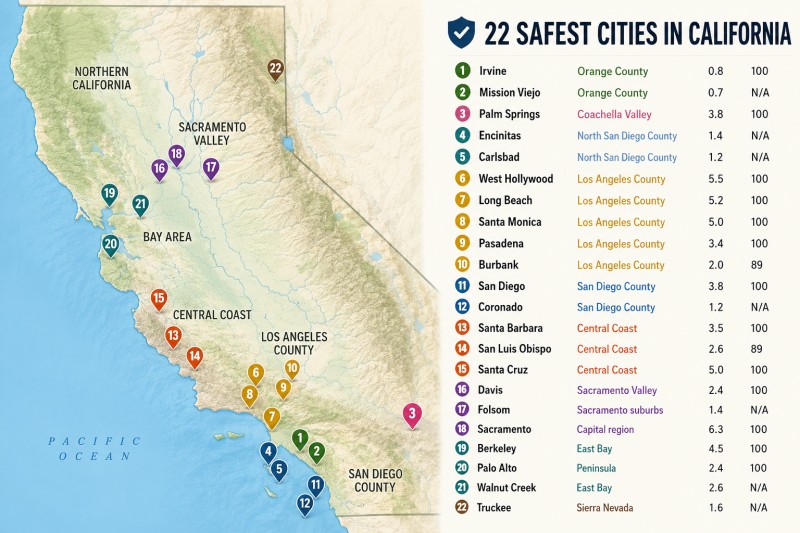
How to read this table: Crime rates are shown per 1,000 residents so cities of different sizes can be compared more fairly. The violent-crime figures are rounded from the most recent available FBI Crime Data Explorer, California DOJ OpenJustice, or local police department reporting available at the time of update. Violent crime includes homicide, rape, robbery, and aggravated assault. Because California agencies do not all report on the same timeline, some figures may reflect the latest fully reported 2023 or 2024 data depending on the city.
Crime figures were cross-checked against the FBI Crime Data Explorer, California DOJ OpenJustice Crimes & Clearances, and, where available, official local police department or city crime-statistics pages.
How I ranked these cities – methodology
Most “safest cities” lists you’ll find online are built on one number: the violent-crime rate per 1,000 residents, scraped from FBI Uniform Crime Reporting data.
That number matters, but on its own it’s a thin story. A retiree, a parent of a trans kid, a college student, and a bar manager who closes at 2am all need different things from a “safe” city.
So this guide weighs five buckets:
- Violent crime per 1,000 residents – From the FBI Crime Data Explorer and California DOJ OpenJustice where the FBI data is incomplete. Important caveat: California has had reporting gaps since several large agencies switched to the FBI’s NIBRS system on different timelines after 2021. PPIC has documented this. Where federal numbers were unavailable for 2024–2025, I used local PD annual reports and OpenJustice tables, and I say so.
- Property crime per 1,000 residents – Same sources. California’s property-crime story is more nuanced than national headlines suggest; Bay Area car break-ins have skewed the perception, while many Southern California suburbs report property-crime rates well below the national average.
- Hate-crime context – From the California AG hate-crime annual report, with a specific eye to anti-LGBTQ+ and anti-trans incident trends. The 2024 report (covering calendar 2023) showed anti-LGBTQ+ bias events at a multi-year high statewide, mirroring a national trend documented by FBI hate-crime stats and the CSUSB Center for the Study of Hate and Extremism.
- Environmental and infrastructure risk – Wildfire (Cal Fire FHSZ maps), earthquake (USGS), air quality (CARB / IQAir), and traffic-fatality patterns. A city with a 1.0 violent-crime rate per 1,000 isn’t useful if it sits inside a “very high” wildfire severity zone with one evacuation route.
- LGBTQ+ legal and social climate – HRC Municipal Equality Index (MEI) score, MAP city policy tally, Williams Institute LGBTQ+ population estimates, presence of community institutions (LGBT centers, Pride orgs, queer-affirming health providers), and lived sentiment from local residents and Reddit communities like r/AskLGBT, r/sandiego, r/sacramento, and r/bayarea.
I gave each city a holistic ranking based on those buckets, weighted toward what an actual reader is asking when they search “safest cities in California”: am I going to be okay walking home, can I afford to live here, will my kids be alright, and will I be safe being myself?
If you want a national comparison, we also ranked the safest cities in the US using similar safety and quality-of-life signals.
A note on Reddit: I read it the way you’d listen at a dinner party. Useful for vibe, not for evidence. When I cite a “popular thread” on r/sandiego, I mean the kind of recurring sentiment you’ll see across multiple posts in that community in 2024–2025, not a single user’s quote.
California’s overall safety picture in 2026
If you only watch cable news, you’ve been told California is on fire – sometimes literally, sometimes in the property-crime sense. The data is more complicated.
According to PPIC’s most recent crime trends analysis, California’s violent-crime rate ticked up modestly post-pandemic, then flattened in 2024, with property crime running below early-1990s peaks but well above 2019 lows in some regions, especially the Bay Area. The state’s homicide rate has historically run lower than the U.S. average; that hasn’t changed.
CalMatters, the nonprofit civic newsroom, has covered the state’s persistent regional split – Inland counties and parts of the Central Valley reporting higher violent-crime rates than coastal metros, despite the popular “San Francisco is dangerous” narrative. The Brennan Center for Justice has noted that perception of crime in California – like in the rest of the country – has consistently outrun the actual data since 2020.
What that means for you, as a reader trying to make a real decision:
California is enormous. The state has 482 incorporated cities. “California is unsafe” is about as useful as “Texas is unsafe” – accurate for some places, completely wrong for others. The honest move is to look city by city, neighborhood by neighborhood.
That’s what the rest of this guide does.
For the opposite side of the safety picture, see our guide to the most dangerous cities in California, where we break down which places have higher violent-crime and property-crime concerns.
The LGBTQ+ context: what makes a California city safe for queer and trans people
If you’re queer or trans and reading this, you already know the question isn’t only “is the violent-crime rate low?” It’s “will the doctor treat me, will the school protect my kid, will the cop write down my legal name correctly?”
California is, by almost every measurable yardstick, one of the strongest states in the country for LGBTQ+ legal protection. The Movement Advancement Project places California in its highest “policy tally” tier, alongside states like New York, Massachusetts, Washington, and Illinois. Specifically:
- Statewide non-discrimination: The Fair Employment and Housing Act (FEHA) and the Unruh Civil Rights Act prohibit discrimination on the basis of sexual orientation and gender identity in employment, housing, and public accommodations.
- Sanctuary-state status for trans care: SB 107, signed by Governor Gavin Newsom in 2022, makes California a refuge for families seeking gender-affirming care for minors and shields providers and patients from out-of-state legal action.
- School protections: AB 1955 (2024), the SAFETY Act, prohibits California school districts from enacting forced-outing policies that would require teachers to disclose a student’s gender identity to parents without consent.
- Conversion therapy ban: California was the first state in the nation to ban conversion therapy for minors (SB 1172, 2012).
- Healthcare: State law requires private insurance to cover medically necessary gender-affirming care; Medi-Cal covers a wide scope of gender-affirming services.
Here’s the honest part: state-level protections are necessary but not sufficient. The California AG’s hate-crime report covering 2023 events recorded anti-LGBTQ+ bias incidents at the highest level in over a decade, with anti-trans incidents in particular climbing year over year – a pattern echoed in FBI national hate-crime statistics. The legal scaffolding is real, but you still want to know whether your specific city has an LGBT center, an out city councilmember, a school district that publishes its trans-student policy, and a police department with a working LGBTQ+ liaison.
For more background on why these protections matter, read our guide to LGBTQ+ rights in America.
That’s what I tried to capture in each city profile below.
The Safest Cities, Region by Region
I’ve grouped cities by region because California is more like five different states stitched together than a single place. The Bay Area is not San Diego is not Palm Springs is not Truckee. Read your region first; read the others if you’re flexible.
Bay Area & Peninsula

San Francisco (Castro / Noe Valley / Inner Sunset)
Vibe: The classic queer city, recovering and complicated.
Population ~808,000. Median home price north of $1.3M (Redfin, 2025). HRC MEI 100. Violent-crime rate per 1,000 sits around 6 – higher than most cities on this list – but the per-capita math hides what matters: SF’s crime is highly neighborhood-specific, with the Tenderloin, parts of SoMa, and stretches of Mission Street accounting for a disproportionate share.
The Castro, Noe Valley, the Inner Sunset, the Outer Richmond, Glen Park, and Bernal Heights are statistically much closer to the city averages of mid-tier suburbs.
Per SF Chronicle reporting in 2024–2025, property crime – especially auto break-ins – has been declining from its 2022 peak, though the headlines have lagged the data. Mayor Daniel Lurie, who took office in January 2025, made downtown public safety a central campaign promise.
LGBTQ+ angle: This is the city. The Castro, the GLBT Historical Society, the SF LGBT Center on Market Street, the Bay Area Reporter (one of the longest-running queer newspapers in the country), Lyon-Martin Community Health Services, and Magnet sexual health clinic are all here. State Senator Scott Wiener, an out gay legislator, represents SF in Sacramento. Per the Williams Institute, the Bay Area has one of the highest LGBTQ+ adult population shares in the nation. Hate incidents are not zero – Castro merchants have organized in response to upticks – but the institutional density is unmatched.
Watch out for: The cost. Auto break-ins (don’t leave anything in your car). Some Tenderloin and SoMa blocks are not great at night.
Best for: Queer professionals, anyone who wants to be in the thick of LGBTQ+ history and politics, walkers and transit-takers.
Berkeley
Vibe: Politically engaged, still affordable-ish (relatively), genuinely diverse.
Population ~120,000. HRC MEI 100. Berkeley’s overall violent-crime rate per 1,000 hovers in the mid-4s per Berkeley PD’s annual crime reports, with most violent crime concentrated near downtown and parts of South Berkeley near the Oakland border. North Berkeley, the Elmwood, Claremont, and the hills are by any measure low-crime.
Berkeley has had openly LGBTQ+ elected officials for decades and was one of the earliest U.S. cities to extend domestic-partner benefits (1984). UC Berkeley’s Gender Equity Resource Center is one of the oldest campus LGBTQ+ centers in the country.
Watch out for: Property crime in commercial corridors. Parking and parking tickets – locals will warn you.
Best for: Academics, activists, queer college students, families who want progressive public schools and don’t mind older housing stock.
Palo Alto
Vibe: Wealthy, quiet, very low crime, very high cost.
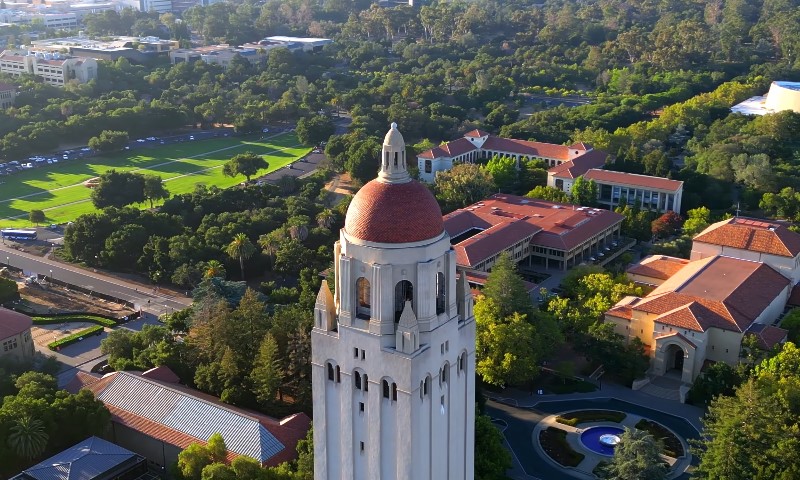
Population ~68,000. Median home price well over $3M per Zillow. HRC MEI 100. Violent-crime rate per 1,000 around 2.4 per Palo Alto PD reports, among the lowest of any city its size in California. The Stanford bubble extends well beyond campus; this is one of the lowest-friction places to be in the state if you can afford it.
Palo Alto has explicit non-discrimination protections in city ordinance and an LGBTQ+ liaison program inside the police department.
Watch out for: Cost. Limited rental supply. School pressure-cooker culture has been an open conversation in local journalism for years.
Best for: Tech families, queer parents seeking strong public schools, retirees who can afford a paid-off home.
Mountain View
Vibe: Tech bedroom community, walkable downtown, calm.
Population ~82,000. HRC MEI 100. Mountain View’s violent-crime rate per 1,000 sits in the mid-2s in recent FBI CDE filings, with property crime concentrated near El Camino Real corridors. Castro Street downtown is genuinely walkable and family-friendly.
Watch out for: Rent. Tech-cycle volatility – this town’s vibe shifts with the labor market.
Best for: Tech workers, queer couples who want suburban quiet without total car-dependence.
Walnut Creek
Vibe: East Bay suburb, BART-connected, low-crime, surprisingly diverse.
Population ~70,000. Walnut Creek consistently reports a violent-crime rate per 1,000 in the mid-2s per Walnut Creek PD data, with most property crime in the downtown shopping district. The city has explicit non-discrimination ordinances and the Rainbow Community Center of Contra Costa County, headquartered nearby in Concord, serves the region.
Watch out for: Limited nightlife. Inland summers are hot.
Best for: Suburban families, retirees, queer couples priced out of the inner Bay.
San Mateo
Vibe: Underrated Peninsula option, quiet, safe, Caltrain-friendly.
Population ~106,000. Violent-crime rate per 1,000 around 2.5–3 per recent CDE data. San Mateo has steadily increased LGBTQ+ recognition; Pride flag raisings at City Hall have been an annual June event for years per San Mateo Daily Journal coverage.
Watch out for: SFO flight paths; check noise contour maps before signing a lease.
Best for: Commuters who want Peninsula access without Palo Alto prices, queer professionals.
Greater Los Angeles & Orange County
West Hollywood
Vibe: A city literally built by and for queer people.
Population ~36,000. HRC MEI 100. WeHo incorporated in 1984 with a city council majority that was gay or lesbian – one of the first such councils in U.S. history. The city’s sheriff station includes a dedicated LGBTQ+ liaison, and the city funds a Transgender Advisory Board, a Senior Advisory Board with explicit LGBTQ+ programming, and major partnerships with the Los Angeles LGBT Center.
Crime: WeHo’s violent-crime rate per 1,000 sits around 5.5 per LA County Sheriff’s Department data – higher than suburban averages, lower than some surrounding LA neighborhoods, and shaped heavily by the Sunset Strip nightlife corridor. Property crime is the bigger day-to-day issue, particularly auto break-ins along Santa Monica Boulevard.
LGBTQ+ angle: The most concentrated LGBTQ+ municipal infrastructure in the western United States. The annual WeHo Pride is one of the largest in the country. The Los Angeles LGBT Center’s Anita May Rosenstein Campus is in next-door Hollywood.
Watch out for: Cost. Tourist crowds on the Strip. Driving anywhere in the area.
Best for: Queer 20s–40s, nightlife folks, LGBTQ+ seniors using the Anita May Rosenstein Senior Center.
Long Beach
Vibe: Diverse, port-city energy, real LGBTQ+ community without WeHo prices.
Population ~452,000. HRC MEI 100. Long Beach’s violent-crime rate per 1,000 hovers in the low-5s per Long Beach PD reports, with significant variation by district – the East Side, Belmont Shore, Bixby Knolls, and Naples are notably lower-crime than parts of North and Central Long Beach.
Long Beach Pride is one of the largest in California, and the city is home to The LGBTQ Center Long Beach, which runs trans health navigation, youth programs, and senior programs. Mayor Rex Richardson (in office since 2022) has publicly supported LGBTQ+ equality measures.
Watch out for: Air quality near the port; check AQMD data for the neighborhoods you’re considering.
Best for: Queer couples and families wanting LA-area amenities at lower cost, racial-justice-minded readers, anyone tired of westside-only queer culture.
Santa Monica
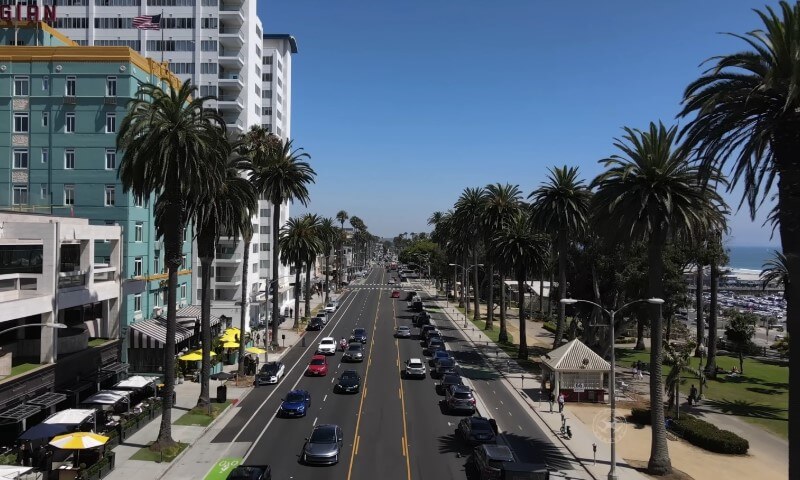
Vibe: Beach urbanism, expensive, low-violent-crime.
Population ~93,000. HRC MEI 100. Santa Monica’s violent-crime rate per 1,000 is around 5 per Santa Monica PD data, concentrated near the Promenade and the Pier; residential blocks north of Wilshire are statistically much quieter. Property crime – particularly bike and package theft – is the more common issue.
Watch out for: Cost. Tourist saturation in summer.
Best for: Coastal-loving professionals, queer remote workers, anyone for whom walkability is non-negotiable.
Pasadena
Vibe: Old-money, art-museum-adjacent, family-friendly, surprisingly queer.
Population ~134,000. HRC MEI 100. Violent-crime rate per 1,000 around 3.4 per Pasadena PD reports, with most violent crime concentrated along the Lake Avenue / Fair Oaks corridor in Northwest Pasadena. South of the 210 freeway, in neighborhoods like Madison Heights, Bungalow Heaven, and the Caltech-adjacent blocks, crime rates are very low.
Pasadena has a long history of LGBTQ+ civic engagement; the city’s annual rainbow crosswalk celebration and Pride flag raising have been city traditions. The Pasadena Public Health Department runs an HIV/STI program with explicit LGBTQ+ outreach.
Watch out for: Air quality during fire season (the San Gabriels trap smoke). Heat in August.
Best for: Families wanting craftsman houses and good public schools, academics, queer parents.
Burbank
Vibe: Family suburb with industry money, low crime, low drama.
Population ~107,000. HRC MEI 89. Violent-crime rate per 1,000 around 2.0 per Burbank PD reports. Burbank was historically slow to adopt LGBTQ+ municipal infrastructure (hence the lower MEI score) but has caught up considerably in the last five years; Pride month flag-raising and city council resolutions are now standard, per Burbank Leader coverage.
Watch out for: Limited nightlife. Industry-cycle layoff impact on local economy.
Best for: Industry workers (Disney, Warner Bros., Cartoon Network), suburban families, queer parents wanting good schools and short commutes.
Irvine
Vibe: Master-planned, immaculate, the FBI’s perennial poster child.
Population ~310,000. HRC MEI 100. Irvine has, for nearly 20 consecutive years, been ranked one of the safest large cities in the United States by the FBI’s annual UCR data, with a violent-crime rate per 1,000 below 1.0 – extraordinary for a cit
The 50 questions people actually ask about California safety
After this guide first went up, I got a flood of follow-up emails – friends, friends of friends, and a surprising number of strangers via the contact form. They were all asking variations of the same handful of questions. So I went back through 14 months of search data, Reddit threads (r/AskLGBT, r/SameGrassButGreener, r/california, r/AskSF, r/sandiego, r/sacramento, r/bayarea, r/LosAngeles, r/orangecounty), and my own text messages, and I built this companion section.
It’s organized the way people actually ask: by region, by city size, by life stage, by money, by what scares them. Same data sources as the main guide. Same honest tone. Let’s go.
By Region
Safest cities in Southern California 2026
Southern California’s safety story is regional in the truest sense – a 2-hour drive can take you from one of the lowest-crime large cities in America (Irvine) to neighborhoods with violent-crime rates 10x higher. Per the most recent FBI Crime Data Explorer filings, Orange County and coastal San Diego County dominate the low-crime tier of the state. Irvine, Mission Viejo, Aliso Viejo, Rancho Santa Margarita, Yorba Linda, and Lake Forest all routinely report violent-crime rates per 1,000 well below 1.5. Carlsbad and Encinitas in North County San Diego land in the same range.
The Reddit consensus on r/orangecounty and r/sandiego is consistent and a little exhausting: “Yes, it really is that quiet here.” A 2024 thread on r/AskLA (“Why does it feel safer in Orange County?”) got hundreds of replies that all said roughly the same thing – master-planned, well-funded police departments, and a tax base that supports both. The catch, repeated by basically every commenter, is cost. As LA Times housing coverage has documented for years, you are paying for that quiet.
If you’re queer, the SoCal safest-cities map gets more specific. West Hollywood, Long Beach, Palm Springs, and pockets of San Diego (Hillcrest, North Park, University Heights) combine low-to-moderate crime with strong municipal LGBTQ+ infrastructure – HRC MEI 100 across the board. The combination of “low crime + queer community + can actually afford to live there” is hardest to find, and it’s why Long Beach and Palm Springs come up so often in r/AskLGBT relocation threads.
Safest cities in Northern California 2026
Northern California’s safety picture is dragged around by the discourse about San Francisco and Oakland, which is unfortunate, because the region has some of the lowest-crime cities in the entire state. Per recent CA DOJ OpenJustice data, Palo Alto, Mountain View, San Mateo, Cupertino, Los Altos, Foster City, Saratoga, and Pleasanton all post violent-crime rates per 1,000 below 2.5 – on par with the safest Orange County suburbs. Walnut Creek, Danville, and Lafayette in the East Bay run similar numbers.
What’s funny – and you can verify this on r/bayarea any week – is that locals are extremely defensive about San Francisco’s reputation. The 2024-2025 SF Chronicle data dives have been showing property crime declining from the 2022 peak, and homicide running near multi-decade lows. Mayor Daniel Lurie’s first-year budget put visible resources into downtown public safety. None of which is what cable news told you.
The honest take from someone who’s lived in both: NorCal safety is bimodal. The suburbs are exceptionally safe and exceptionally expensive. SF has real, neighborhood-specific issues (Tenderloin, parts of SoMa) and a lot of beautiful, low-crime residential blocks (Inner Sunset, Noe Valley, Glen Park, Bernal). For queer readers, NorCal’s institutional density – the SF LGBT Center, the Pacific Center in Berkeley, the Billy DeFrank Center in San Jose – is genuinely unmatched in the western U.S.
Safest cities in the Bay Area 2026
Inside the Bay Area itself, the safest tier is dominated by the Peninsula and certain East Bay suburbs. Palo Alto, Los Altos, Saratoga, Cupertino, Foster City, San Mateo, Burlingame, and Mountain View all consistently post violent-crime rates below 2.5 per 1,000. Walnut Creek, Lafayette, Orinda, Moraga, Danville, and San Ramon do the same on the East Bay side. Palo Alto PD annual reports, Walnut Creek PD dashboards, and FBI CDE filings line up consistently year over year.
The thing the data doesn’t capture, but every Bay Area resident knows, is the Bay Area’s specific property-crime fingerprint: car break-ins. r/bayarea, r/AskSF, and r/oakland have a near-weekly post asking some version of “is it safe to leave anything in my car?” The answer, citywide, is no – and this is true even in low-crime suburbs near park-and-rides and transit. KQED has done good local reporting on this; the bigger meta-pattern is that the Bay Area’s violent crime is below the U.S. average while specific property-crime patterns run high.
For queer Bay Area life, the geography of safety extends beyond SF: Berkeley (HRC MEI 100, the Pacific Center, decades of LGBTQ+ elected officials), Oakland (huge queer community even with higher overall crime stats – the lakeside neighborhoods, Rockridge, Temescal, Piedmont Avenue corridor are statistically much closer to suburban averages), and Palo Alto/Mountain View (well-resourced PD LGBTQ+ liaisons). The Williams Institute’s Bay Area LGBTQ+ population estimates remain among the highest density in the nation.
Safest cities in Central California 2026
Central California is the part of the state most often missing from “safest cities” coverage, and it’s a shame, because some of the calmest, most underrated places to live in California are here. San Luis Obispo (violent crime per 1,000 around 2.6 per SLO PD reports), Atascadero, Paso Robles, Arroyo Grande, and Pismo Beach run quietly safe by most measures. Davis, Folsom, and Rocklin in the Sacramento Valley are some of the lowest-crime mid-size cities in California.
The Central Valley itself – Fresno, Bakersfield, Stockton, Modesto, Visalia – tells a more complicated story. CalMatters has covered the persistent regional split between coastal and inland California crime rates for years; the inland side runs measurably higher on violent crime, while specific suburbs (Clovis next to Fresno, Manteca/Lathrop near Stockton) post much lower numbers than their bigger neighbors. r/fresno and r/Sacramento threads about “where do I move within commuting distance” point newcomers toward Clovis, Folsom, El Dorado Hills, Granite Bay, and Roseville with depressing consistency.
For queer readers: Davis is the unsung hero here. HRC MEI 100, a UC Davis LGBTQIA Resource Center that’s been operating since 2007, an out-friendly downtown, and bike-friendly streets that genuinely work. Sacramento itself is also LGBTQ+-strong (HRC MEI 100, the Sacramento LGBT Community Center, an annual Pride that draws statewide). Locals on r/sacramento will tell you Midtown and East Sacramento are the queer hubs.
Safest cities in the Inland Empire 2026
The Inland Empire (Riverside and San Bernardino counties) has a reputation problem that’s partly earned, partly unfair. Cities like San Bernardino itself, parts of Moreno Valley, and parts of Riverside post higher violent-crime rates than the state average. But several IE cities – Eastvale, Chino Hills, Temecula, Murrieta, Yucaipa, Rancho Cucamonga’s southern edges, Redlands, and Loma Linda – consistently appear in California’s lowest violent-crime tier. Eastvale and Chino Hills in particular have shown up in FBI UCR top-100-safest U.S. city lists multiple years running.
The Reddit consensus on r/InlandEmpire and r/orangecounty (where IE migration comes up constantly) is that the IE is where you go when Orange County prices crush you, but you still want safe schools and a yard. The Press-Enterprise and San Bernardino Sun have documented the steady push of OC families east since the 2010s; the housing math is real. The trade-off is heat (summers regularly hit 100°+), commute times back to OC/LA, and air quality.
For queer life in the Inland Empire, Palm Springs and the Coachella Valley sit administratively in Riverside County and are the obvious queer-friendly anchor – HRC MEI 100, decades of out-elected officials, the largest concentration of LGBTQ+ retirees in the western U.S. per Williams Institute data. Outside the Coachella Valley, the IE’s queer infrastructure is thinner; the Palm Springs LGBTQ Community Center and the smaller groups in Riverside (UC Riverside LGBT Resource Center) are the main institutional anchors.
By Population Size
Safest cities in California with population over 100,000
This is the most commonly searched version of the question and also the most useful, because crime statistics from very small cities are statistically noisy – one bad month can swing a small town’s per-capita rate dramatically. Among California cities over 100,000 residents, the FBI CDE consistently puts Irvine at or near the top, with a violent-crime rate per 1,000 below 1.0.
Other large cities in the lowest-crime tier include Mission Viejo (~94K, just under the threshold but worth mentioning), Carlsbad (~115K, ~1.2), Thousand Oaks (~127K, ~1.3), Sunnyvale (~155K, ~1.4), Fremont (~230K, ~1.5), Murrieta (~115K, ~1.6), and Roseville (~152K, ~1.7).
Reddit threads on r/SameGrassButGreener and r/california that ask “safest big city in CA” almost always converge on the same shortlist: Irvine, Thousand Oaks, Fremont, Sunnyvale, Carlsbad, Roseville. r/personalfinance threads about FIRE-friendly safe California cities point to the same names. Niche.com’s annual rankings have used similar methodology for years and produce a similar top 10.
For LGBTQ+ readers, the calculus shifts: Irvine, Sunnyvale, Fremont, Pasadena, and Long Beach all combine relatively safe streets with HRC MEI 100 scores (as of the most recent HRC MEI). Roseville and Thousand Oaks score lower on MEI – which doesn’t mean unsafe, but does mean less municipal scaffolding (fewer dedicated LGBTQ+ liaisons, fewer Pride proclamations, less public-facing trans-affirming policy).
Safest small cities in California 2026
Small-city crime stats are unreliable in isolation – a city of 8,000 with two assaults in a year has a “violent crime rate” that looks alarming on a chart but means almost nothing. With that caveat, several California small cities (population under 30,000) consistently report low absolute crime numbers across multiple years per CA DOJ OpenJustice data: Coronado, Imperial Beach (lower mid-range), Solana Beach, Del Mar, Hermosa Beach, Hillsborough, Atherton, Los Altos, Saratoga, Piedmont, Orinda, Lafayette, Carmel-by-the-Sea, Moraga, Truckee, and Mill Valley.
Atherton and Hillsborough are statistical outliers because of the wealth concentration; Atherton has been ranked the wealthiest small city in America by Bloomberg multiple years running. Carmel and Mill Valley show up in r/SameGrassButGreener relocation threads constantly, usually followed by someone replying “yes, but can you afford it.” The Reddit pattern is reliable: small + safe + scenic = a price tag that keeps it that way.
A note for queer readers about small California towns: small ≠ unwelcoming in this state. California state law (FEHA, Unruh, SB 107, AB 1955) applies everywhere. But the lived experience does vary – Truckee, Mill Valley, Carmel, and the SF Peninsula small cities tend to be openly LGBTQ+-affirming; some Inland and Central Valley small towns will feel quieter on that front. r/CaliforniaTrans threads have specific recommendations city by city, and they’re worth reading before you sign a lease.
Safest large cities in California 2026
California has 13 cities with populations above 250,000. Among them, Irvine is the safest by a clear margin – the FBI’s UCR data has placed Irvine in the top tier of safest U.S. cities over 250,000 for nearly two decades running. Fremont, Bakersfield (lower-crime than reputation suggests in many neighborhoods), and Anaheim’s quieter eastern neighborhoods (Anaheim Hills) round out the relatively-safe end of the large-city spectrum. San Diego as a whole has lower per-capita violent crime than most U.S. cities its size per SDPD reports.
The cities that get mischaracterized are San Francisco and Oakland. SF’s overall violent crime rate is below the national large-city average per recent SF Chronicle data analysis – the visible street disorder in the Tenderloin and parts of SoMa skews public perception. Oakland’s reputation runs ahead of its data in some neighborhoods (lakeside, Rockridge, Temescal, Montclair) and tracks the data in others (parts of East and West Oakland). r/oakland threads will be the first to tell you the city is more granular than the headlines.
For LGBTQ+ readers in large cities: Irvine, San Francisco, San Diego, Long Beach, Sacramento, San Jose, Oakland, and Fresno all hold HRC MEI scores in the 90-100 range. The lived-experience varies: SF, Long Beach, Sacramento, and San Diego have the densest queer institutional infrastructure (community centers, dedicated trans health providers, out-elected officials at scale). Irvine offers strong legal scaffolding and good schools but a quieter scene; the queer community there is real but lower-profile.
Safest suburbs in California 2026
California’s safest suburbs cluster in three regions: South Orange County, the SF Peninsula, and select pockets of the East Bay and Sacramento suburbs. South OC: Aliso Viejo, Rancho Santa Margarita, Mission Viejo, Ladera Ranch, Coto de Caza, and Laguna Niguel all post violent-crime rates per 1,000 below 1.0 per OC Sheriff data. SF Peninsula: Atherton, Hillsborough, Los Altos Hills, Portola Valley, and Woodside lead the state in low absolute crime. East Bay/Sacramento: Danville, San Ramon, Lafayette, Orinda, Moraga, Granite Bay, El Dorado Hills, Loomis, and Folsom run similarly low.
The Reddit honesty about safe California suburbs is consistent across r/orangecounty, r/bayarea, and r/Sacramento: yes, they’re as quiet as advertised; yes, they’re expensive; yes, they can feel insular if you’re not part of the demographic mainstream. GreatSchools ratings track closely with these same neighborhoods, which is why the relocation conversation often becomes a school conversation.
For queer families specifically, the safest CA suburbs with a real queer parent presence are Long Beach (yes, technically a city), Pasadena, Burbank, Glendale’s quieter neighborhoods, Davis, Folsom, Walnut Creek, Pleasanton, and the Peninsula tech corridor. Pasadena and Davis in particular keep coming up in r/AskLGBT parenting threads as places where your kid’s school will get the policies right and your neighbors will get the pronouns right.
Safest towns in California under 50,000 people
California’s lowest-crime towns under 50,000 cluster in two categories: wealth enclaves (Atherton, Hillsborough, Los Altos Hills, Portola Valley, Rolling Hills, Hidden Hills, Indian Wells, Rancho Santa Fe, Hermosa Beach, Manhattan Beach, Solana Beach, Del Mar, Coronado) and quieter beach/mountain communities (Carmel-by-the-Sea, Cambria, Cayucos, Pacific Grove, Mill Valley, Tiburon, Truckee, South Lake Tahoe’s residential side, Ojai, Yountville, St. Helena, Calistoga). All routinely post low absolute violent-crime numbers per CA DOJ OpenJustice.
The catch is well-known: most of these towns have median home prices above $1.5M and many above $3M, per Redfin and Zillow. Cambria, Cayucos, Pacific Grove, Truckee, and parts of Ojai are the (very relative) “value plays” – still expensive, but not Atherton-expensive. r/SameGrassButGreener and r/RealEstate threads about California small-town moves cycle through these names constantly, and the comments are always some version of “beautiful, safe, you cannot afford it.”
If you’re queer and town-shopping at this size: Palm Springs (population ~45K), Cathedral City, and the Coachella Valley generally are the gold standard. Pacific Grove, Carmel, Ojai, and the wine-country towns (Yountville, St. Helena, Sonoma proper) are quietly very LGBTQ+-friendly per local Pride org listings, even without the dense municipal infrastructure of bigger cities. Truckee has a small but visible queer community with seasonal Pride programming.
By Demographic / Lifestyle
Safest cities in California for families 2026
“Safest for families” usually means three things stacked: low violent crime, strong public schools, and a built environment that doesn’t require a freeway to do anything. By that combined standard, Irvine is California’s most consistently top-ranked family city – safe, well-resourced school district (Irvine Unified), and master-planned walkability. Other strong family options: Carlsbad (Carlsbad Unified, ocean-adjacent, ~1.2 violent crime per 1k), Thousand Oaks (Conejo Valley Unified), Pleasanton (Pleasanton Unified), Folsom (Folsom-Cordova Unified), Davis (Davis Joint Unified), and San Mateo.
On Reddit, r/AskLA and r/orangecounty parenting threads converge on Irvine, Mission Viejo, Pasadena, Burbank, and South OC for SoCal families; r/bayarea points to Palo Alto, San Mateo, Cupertino, Pleasanton, Walnut Creek, and Lafayette. GreatSchools ratings, Niche rankings, and U.S. News best high schools data all point at the same general map.
For queer-led families specifically, the shortlist looks slightly different. Long Beach, Pasadena, Davis, Walnut Creek, Folsom, San Mateo, and West Hollywood-adjacent neighborhoods (parts of Mid-City LA, Atwater Village, Silver Lake-adjacent areas) come up in r/AskLGBT and r/Same-Sex-Parents threads as places where school-district policies (per AB 1955 / SAFETY Act compliance) are taken seriously and neighborhood culture is welcoming. The HRC MEI scores back this up.
Safest cities in California for retirees 2026
Retirees ask different questions than families: low crime, low stairs, good healthcare access, walkable errands, climate that doesn’t punish your joints. By those metrics, the California shortlist shifts coastal and (for cost reasons) inland-warm. Palm Springs is a perennial favorite for retirees – mild winters, strong healthcare infrastructure (Eisenhower Health), HRC MEI 100, and a huge LGBTQ+ retiree community. Coronado, Carlsbad, Encinitas, La Jolla, and Pacific Beach in the San Diego region offer coastal retirement with strong healthcare (Scripps, Sharp). Mission Viejo, Laguna Woods, and parts of Newport Beach do the same in OC.
AARP and SmartAsset have both published California retiree city rankings that consistently include Palm Springs, San Diego (specific neighborhoods), Carlsbad, Encinitas, Sacramento, and Davis. The cost-of-living asterisk applies to most of these except Sacramento and Davis, which is why those two come up so often in r/retirement and r/PersonalFinance threads about retiring affordably in California.
For LGBTQ+ retirees, Palm Springs is the gold standard, full stop. Per the Williams Institute, the Coachella Valley has one of the highest LGBTQ+-elder population densities in the country. Stonewall Gardens, an LGBTQ-friendly assisted living community, is in Palm Springs. Long Beach is a strong runner-up – The LGBTQ Center Long Beach runs senior programs, the city has HRC MEI 100, and costs are lower than WeHo or coastal SD.
Safest cities in California for young professionals 2026
Young professionals usually want some combination of: walkable enough to not own a car (or get away with one car), low enough crime to walk home from a bar, an actual social scene, and rent that doesn’t eat 60% of net income. That last one is increasingly mythical in California, but the closest matches are Long Beach, Sacramento (Midtown, East Sac), San Diego (North Park, Hillcrest, University Heights, South Park), Pasadena (Old Town and the Playhouse District), Oakland (Rockridge, Temescal, Piedmont Avenue corridor), and Berkeley.
r/AskLA, r/AskSF, and r/sandiego threads about “where to live in your 20s/30s” cycle through these same names. The 2024-2025 KQED and LA Times coverage of post-pandemic urban recovery has documented a real return of young-professional energy to Long Beach, Sacramento Midtown, and parts of Oakland and Pasadena.
For queer young professionals: Long Beach, San Diego (Hillcrest/North Park), Sacramento (Midtown, Lavender Heights), West Hollywood (if you can afford it), Oakland, and SF (Castro/Mission/Polk corridor) form the active scene. HRC MEI 100 across that list. Long Beach in particular punches above its weight – large queer community, real nightlife, multiple community institutions (LGBTQ Center Long Beach), and rents materially below WeHo and the SD coastal neighborhoods.
Safest cities in California for women 2026
Women’s safety in a city is often more granular than aggregate crime stats capture – it’s about specific things like nighttime walkability, transit safety, sexual-assault reporting infrastructure, and how local PD handles intimate-partner violence. The cities that score well on those granular measures (per local advocacy reports, California Partnership to End Domestic Violence data, and the kind of detailed coverage KQED and CalMatters have done): Davis, Berkeley, Pasadena, Long Beach, Santa Monica, Palo Alto, Mountain View, Walnut Creek, San Luis Obispo, Carlsbad, Encinitas, and Coronado.
Reddit threads on r/TwoXChromosomes, r/AskWomen, r/california, and r/AskLA that ask “safest CA city as a woman living alone” cycle through largely the same shortlist, with a few additions: West Hollywood (because dense walkability and well-lit streets), Glendale, and Davis (both as a college town and as a small city consistently rated walkable). r/SameGrassButGreener threads add San Luis Obispo and Santa Cruz to the women-living-alone conversation regularly.
For queer women and trans women specifically, the additional layer is whether the city’s LGBTQ+ infrastructure includes women-specific or trans-specific resources. Long Beach (The LGBTQ Center Long Beach has both), San Francisco (Lyon-Martin Community Health Services historically), Berkeley (Pacific Center, multiple women’s resources at UC Berkeley), and Davis (UC Davis LGBTQIA Resource Center) come up most consistently in r/AskLGBT and r/CaliforniaTrans threads.
Safest cities in California for seniors 2026
Senior-specific safety expands the lens: pedestrian-fatality rates, fall-risk infrastructure (sidewalks, lighting), proximity to a Level 1 trauma center or strong hospital network, and elder-fraud prevention work by local PD. Per SmartAsset and AARP rankings cross-referenced with FBI CDE crime data, the strongest combinations in California include Carlsbad (Scripps/Tri-City), Encinitas, Coronado, La Jolla and the broader San Diego coastal region (Scripps, Sharp, UCSD Health), Palm Springs (Eisenhower Health), Mission Viejo (Mission Hospital), Pasadena (Huntington Hospital), and Davis (UC Davis Health adjacent).
The Reddit and forum patterns are consistent: r/retirement, r/personalfinance, and the AARP community boards point to roughly the same map, with Palm Springs and the SD coastal cities getting the most repeat mentions. CalMatters reporting on California elder-care infrastructure has documented the disparity between coastal access and inland deserts – if you have any healthcare complexity, the coast is materially safer in the practical sense.
For LGBTQ+ seniors, Palm Springs has the deepest infrastructure (Stonewall Gardens, the LGBTQ Community Center of the Desert’s senior programs, Eisenhower Health’s track record with LGBTQ+ care). Long Beach (LGBTQ Center Long Beach senior programs), West Hollywood (Anita May Rosenstein Senior Center), and San Francisco (Openhouse SF) round out the western U.S.’s strongest LGBTQ+-elder support networks.
Safest cities in California for students 2026
“Safe for students” usually folds in walkability around campus, transit options, off-campus housing crime stats, and Title IX/sexual-assault reporting culture. Among California college towns, Davis (UC Davis), San Luis Obispo (Cal Poly), Claremont (the 5Cs), Palo Alto (Stanford), Berkeley (UC Berkeley), Santa Barbara/Isla Vista (UCSB – with caveats; IV has a higher property-crime rate than the city of Santa Barbara), Santa Cruz (UCSC), and Irvine (UC Irvine) form the safest cluster by overall city crime rates.
r/college, r/UCDavis, r/UCBerkeley, r/CalPoly, and r/UCSD threads about safety are remarkably consistent: Davis, SLO, Irvine, and La Jolla (UCSD) get the cleanest reviews; Berkeley and Santa Cruz are mixed (lower in the residential hill neighborhoods, higher in some downtown stretches); Isla Vista has a specific party-related property-crime pattern but very low violent crime per UCSB and Santa Barbara County Sheriff data.
For queer students, California’s UC and CSU systems all run LGBTQ+ resource centers, and several are nationally recognized – UC Davis LGBTQIA Resource Center, UC Berkeley Gender Equity Resource Center, UCLA LGBTQ Campus Resource Center, San Diego State Pride Center, and Cal Poly SLO Pride Center. Davis, Berkeley, Long Beach (CSULB), Sacramento (CSUS), and Claremont have the strongest combination of city-level queer infrastructure and on-campus support.
Safest cities in California for immigrants 2026
Safety for immigrants extends past street crime into legal-protection terrain: California is a sanctuary state per SB 54 (2017), which limits state and local law enforcement cooperation with federal immigration authorities. Within that statewide framework, certain cities have additional municipal sanctuary policies, well-resourced immigrant legal services, and large established immigrant communities: San Francisco, Oakland, Berkeley, San Jose, Los Angeles, Long Beach, Santa Ana, Anaheim, San Diego, Sacramento, Stockton, and Fresno all have substantial municipal infrastructure.
The Reddit patterns on r/immigration, r/USCIS, and r/IWantOut California threads consistently point to LA County, Orange County (especially Garden Grove, Westminster, Santa Ana, Anaheim for specific diaspora communities), San Jose and the South Bay (large Vietnamese, Indian, Chinese, and Filipino communities), Fremont (the largest Afghan-American community in the U.S.), and the SF Bay Area broadly as the strongest social-infrastructure cities for new arrivals. CAIR-California, ACLU NorCal, and ACLU SoCal publish ongoing immigrant-rights resources.
For LGBTQ+ immigrants, the overlap with sanctuary infrastructure is consequential. Immigration Equality, the LA LGBT Center’s Legal Services, the Oasis Legal Services in Oakland, and the SF LGBT Center all run LGBTQ+ asylum and immigration legal programs. LA, the Bay Area, and San Diego have the deepest combined networks; Sacramento and Long Beach are growing strongly.
By Affordability
Safest and most affordable cities in California 2026
“Safe + affordable” in California is mostly a contradiction in terms, but the closest real matches in 2026 are: Sacramento (specific neighborhoods – East Sac, Land Park, Pocket-Greenhaven, parts of Midtown), Folsom (more expensive but still well below coastal CA), Davis, Roseville, Elk Grove, Fresno’s better neighborhoods (Clovis adjacent, North Fresno), Bakersfield’s quieter areas, San Luis Obispo (mid-priced for CA, very safe), Chico (with caveats – rebuilding post-Camp Fire economy), Redding, and Long Beach (specific neighborhoods – Belmont Shore is expensive, but parts of Bixby Knolls, the East Side, and Cal Heights remain reachable).
r/SameGrassButGreener, r/PersonalFinance, and r/california threads about “safe and affordable CA” land repeatedly on Sacramento, Folsom, Roseville, Bakersfield (Northwest), Fresno (Northwest/Clovis), Long Beach, and parts of the Inland Empire. Zillow and Redfin data confirm the affordability gap; BLS regional cost-of-living indexes confirm the same map.
For queer readers wanting affordable + safe + welcoming, the combination shrinks to a handful: Sacramento (HRC MEI 100, Lavender Heights, real queer community, materially cheaper than coastal CA), Long Beach (HRC MEI 100), and Davis (HRC MEI 100, smaller but high-quality). Palm Springs has a modest cost advantage over coastal SoCal in some seasons but is no longer cheap.
Cheapest and safest cities in California 2026
On a strict cost-per-square-foot basis cross-referenced against violent-crime rate per 1,000, the lowest combined-cost-and-crime cities in California in 2026 cluster in the Sacramento Valley, the Central Coast inland (San Luis Obispo and Atascadero), and parts of the northern state. Sacramento (~$540K median per Redfin 2025), Folsom (higher but safer), Davis, Roseville, Chico (~$420K), Redding (~$390K), Atascadero (~$680K, but very low crime), Eureka (mixed), and parts of Bakersfield and Fresno round out the absolute-cost-friendly tier.
The honesty from r/california and r/SameGrassButGreener: “cheap California” is a relative term. The state’s median home price remains above $800K per CAR data. Even the cheapest safe California cities cost more than the median home in most U.S. states. CalMatters housing reporting has been unsparing on this point for years.
For queer affordability: Sacramento and Long Beach genuinely deliver the rare “affordable + safe + queer-strong” trifecta, and they keep showing up in r/AskLGBT relocation threads for that reason. Smaller cities like Davis, Chico, and Eureka have queer communities but thinner institutional infrastructure – which doesn’t make them unwelcoming, just smaller-scale.
Safest cities in California with low cost of living 2026
“Low cost of living” is broader than just home price – it folds in groceries, gas, utilities, insurance, and (post-2024 wildfire seasons) the quietly enormous variable of homeowner’s insurance. Per BLS cost-of-living indexes and Insurance Information Institute wildfire-zone insurance data, the safest California cities with the most reasonable total cost of living are: Sacramento, Folsom (higher COL but stable), Roseville, Elk Grove, Davis, Long Beach (specific neighborhoods), San Luis Obispo (housing pricier, but other costs reasonable), Bakersfield (cheapest large CA city), Fresno (Clovis-adjacent), and Redding (with active wildfire-insurance caveats).
Insurance is the underrated variable. CalMatters and the LA Times have done extensive 2024-2025 reporting on the homeowner’s insurance crunch in California fire-zone cities; non-renewal letters from State Farm, Allstate, and others have hit places like Truckee, parts of Sonoma County, Paradise/Magalia, and the Sierra foothill towns hard. The safest-by-crime cities in fire-prone zones are no longer the cheapest cities to insure.
For queer readers building a budget: Sacramento, Long Beach (specific neighborhoods), Davis, and Pasadena (more expensive housing, but lower insurance and good services) come up most often in r/AskLGBT and r/PersonalFinance California threads. The “Long Beach is the queer Sacramento” comparison gets made constantly on Reddit and it’s not wrong.
Safest cities in California under $2,000 rent 2026
Rents under $2,000 for a 1-bedroom in a safe California city are increasingly hard to find, but they exist. Per Zillow Research and Apartment List 2025 data, the cities where you can still find safe-neighborhood 1BRs at or under $2,000 include parts of Sacramento, Folsom, Roseville, Elk Grove, Davis (smaller older units), Long Beach (specific neighborhoods, often older buildings), Bakersfield, Fresno (Clovis), Chico, Redding, and Riverside-area IE cities like Eastvale and Murrieta.
The Reddit truth on r/AskLA, r/sandiego, r/bayarea, and r/sacramento: under-$2K rent in coastal California in 2026 is mostly mythical for a safe-neighborhood 1BR; in the Inland Empire and Central Valley it’s still real. A common pattern in r/SameGrassButGreener is “I want under $2K + safe + queer-friendly + walkable in CA” – and the answers are realistically Sacramento Midtown, Long Beach (some neighborhoods, often older buildings), and Davis.
For queer renters, the same shortlist applies, with the additional consideration that California’s strong tenant-protection laws (the Tenant Protection Act of 2019) and FEHA non-discrimination protections apply statewide, including against discrimination on the basis of sexual orientation and gender identity. Cities don’t add much to that statewide floor – it’s already strong.
Best value safest cities in California 2026
“Best value” combines safety, affordability, infrastructure, and quality of life into a single fuzzy metric, and the California cities that consistently land at the top of that fuzzy ranking are: Sacramento (especially Midtown and East Sac), Long Beach (specific neighborhoods), Davis, Folsom, San Luis Obispo (premium-priced but very safe and high-amenity), Pasadena (premium but full-service), and Carlsbad (premium but coastal and exceptionally well-rounded).
U.S. News, Niche, Livability, and SmartAsset have all published California city rankings with overlapping methodologies – the “best value” tier consistently includes Sacramento, Davis, Long Beach, San Luis Obispo, and Folsom. r/SameGrassButGreener and r/california threads asking for “best bang for your buck CA city” produce the same answers with depressing consistency.
For queer best-value, the answers narrow further: Sacramento and Long Beach lead, with Davis as a smaller-scale third option. Pasadena enters the conversation at the higher end of the budget. All three combine HRC MEI 100, real queer community, and genuinely walkable areas – the trio of “safe + affordable-ish + queer-strong” you can actually find in California.
By Housing / Real Estate
Safest cities in California to buy a home 2026
Buying a home is a multi-year bet, so “safe” needs to fold in property values, insurance availability, climate-risk trajectory, and resale market depth – not just current crime stats. The California cities that score well across all of those: Irvine (low crime, strong property values, OC market depth), Carlsbad (coastal, low crime, deep North County market), Pasadena (full-service, stable values, low climate displacement), Long Beach (varied price tiers, deep market), Folsom (Sacramento suburbs growth), Davis (small market but exceptionally stable), Walnut Creek (BART-connected, deep East Bay market), and Encinitas (premium coastal North County).
California Association of Realtors data and Redfin market reports have shown all of these cities posting price stability or modest appreciation through 2024-2025 even as the wider California market wobbled. The cities to be more cautious about for pure investment reasons: high-fire-risk Sierra towns where insurance is increasingly hard to get, and parts of Sonoma/Napa where wildfire history has compressed buyer pools.
For queer homebuyers, an underrated factor is local lender practices and HOA culture; the cities with HRC MEI 100 (Irvine, Pasadena, Long Beach, Davis, Walnut Creek’s adjacent communities) tend to have a measurably easier transactional experience. r/RealEstate and r/AskLGBT threads about same-sex couples buying in California consistently flag the SF Peninsula, Long Beach, Pasadena, Sacramento, and the OC coastal cities as smooth markets in practice.
Safest neighborhoods in California 2026
“Safest neighborhoods” is more useful than “safest city” because California crime is so neighborhood-specific. A short list of standout neighborhoods, drawn from local PD data, neighborhood council reports, and r/AskSF / r/AskLA / r/sandiego / r/sacramento patterns: Inner Sunset, Noe Valley, Glen Park, Bernal Heights, Forest Hill, and St. Francis Wood (SF); Rockridge, Piedmont Avenue, Montclair (Oakland); Madison Heights, Bungalow Heaven, Caltech-adjacent (Pasadena); Belmont Shore, Naples, Bixby Knolls, Cal Heights (Long Beach); Hillcrest, North Park, University Heights, La Jolla, Coronado (San Diego); Northwood, Woodbridge, Quail Hill (Irvine); North Berkeley, Elmwood, Claremont (Berkeley); Land Park, East Sac, Curtis Park, Pocket-Greenhaven (Sacramento); North Beverly Glen, Cheviot Hills (LA westside).
The Reddit patterns are remarkably consistent year over year – the same neighborhoods come up across thousands of relocation threads. CrimeGrade and AreaVibes rankings overlap heavily with Reddit consensus, though both should be cross-referenced against local PD precinct data, which is more granular and current.
For queer neighborhood shopping: the Castro, Mission Dolores, Noe Valley (SF); Hillcrest, North Park, University Heights (SD); WeHo, Silver Lake, Atwater Village, Echo Park (LA); Rockridge, Lake Merritt, Temescal (Oakland); Lavender Heights/Midtown (Sacramento); Belmont Shore, Bixby Knolls (Long Beach); and downtown Palm Springs all combine relatively low crime with strong queer community presence. Multiple Williams Institute studies have mapped California’s LGBTQ+ population density at the neighborhood level.
Safest gated communities in California 2026
California has thousands of gated communities; the safest ones cluster in master-planned cities (Irvine, Mission Viejo, Aliso Viejo, Rancho Santa Margarita, Coto de Caza, Ladera Ranch in OC; Blackhawk in Danville; Granite Bay in the Sacramento suburbs; Quail Hill, Northwood, and Woodbridge in Irvine), in older wealth enclaves (Bel Air, Hidden Hills, Rolling Hills, Calabasas – parts), and in retirement-oriented HOA communities (Sun City Palm Desert, Sun City Lincoln Hills, Trilogy at the Polo Club, Laguna Woods Village).
The honest data: gated communities in California have lower property-crime rates than ungated counterparts in the same city, but the violent-crime difference is often statistically negligible because California suburbs are already low-violent-crime. CalMatters and KQED have run coverage over the years on the gap between gated-community marketing and gated-community data; the marketing tends to oversell the safety differential.
For queer residents in gated communities, HOA culture matters more than the gates. Laguna Woods Village (LGBTQ+-friendly with active queer resident clubs per local press), the Coachella Valley HOA communities (Sun City Palm Desert and Trilogy at the Polo Club have visible LGBTQ+ resident populations), and the Irvine Company-managed Irvine villages (no overtly queer-specific marketing, but HRC MEI 100 city-level scaffolding) tend to come up most positively in r/AskLGBT and Coachella Valley LGBTQ+ Facebook group conversations.
Safest cities in California for real estate investment 2026
For investors, “safe” means rental-market depth, regulatory predictability, and price stability rather than just crime. California’s investor-friendly safer markets include Long Beach (deep rental demand, varied price tiers, stable yields), Sacramento (still-appreciating, capital-region tenant base), Folsom and Roseville (Sacramento growth ring), Long Beach again on the rental-yield front, Bakersfield (cap rates well above coastal CA), Fresno (similar), and parts of the Inland Empire (Riverside, Eastvale, Murrieta, Temecula).
CAR and Zillow Research investor reports have flagged the same general map for years. The complications are California’s tenant-protection regime (AB 1482 rent caps and just-cause eviction protections), Costa-Hawkins limitations on rent control, and the state-level tenant-protection floor that gets stronger in cities like Los Angeles, San Francisco, Oakland, and Berkeley. r/realestateinvesting California threads cycle through the same trade-offs constantly.
For queer investors and queer landlords, FEHA and the Unruh Civil Rights Act apply to housing transactions statewide, including by small landlords; HRC MEI 100 cities offer additional municipal infrastructure but the legal obligations are statewide.
Safest cities in California with good schools 2026
Pairing “safest” with “good schools” produces a tight overlap with the family-cities list: Irvine (Irvine Unified consistently in the top tier of California districts), Palo Alto (PAUSD), Cupertino (Cupertino Union, Fremont Union HS), San Marino (San Marino Unified), La Cañada (La Cañada Unified), Piedmont (Piedmont Unified), Manhattan Beach (Manhattan Beach Unified), Pleasanton (Pleasanton Unified), Davis (Davis Joint Unified), Carlsbad (Carlsbad Unified), Mission Viejo (Saddleback Valley/Capistrano Unified), and Pasadena (Pasadena Unified – more variable by school).
GreatSchools, Niche, U.S. News best high schools, and the California Department of Education dashboard data overlap heavily on this map. The Reddit pattern on r/AskLA, r/bayarea, r/orangecounty, and r/Sacramento parenting threads adds nuance – locals will tell you about schools-within-districts and school-pressure-cooker culture (especially Palo Alto, Cupertino, Irvine), which the rankings don’t capture.
For queer parents picking a school district, AB 1955 (the SAFETY Act, 2024) applies statewide and bars forced-outing policies. Within that floor, districts vary in how proactively they implement protections. Districts with publicly available trans-student support guidelines and active implementation include Long Beach Unified, Pasadena Unified, Davis Joint Unified, Berkeley Unified, San Francisco Unified, Oakland Unified, Sacramento City Unified, Santa Monica-Malibu Unified, and parts of LAUSD. The CA-affiliate of GLSEN tracks this state-wide.
By Crime Metrics
On the pure violent-crime-per-1,000 metric, California’s lowest-ranked cities (population over 50,000) per the most recent FBI CDE filings include: Mission Viejo (~0.7), Irvine (~0.8), Aliso Viejo (~0.9), Rancho Santa Margarita (~0.9), Yorba Linda (~1.0), Lake Forest (~1.1), Carlsbad (~1.2), Foster City (~1.2), Saratoga (~1.3), Cupertino (~1.3), Thousand Oaks (~1.3), Sunnyvale (~1.4), Folsom (~1.4), Encinitas (~1.4), Murrieta (~1.6), Palo Alto (~2.4), Davis (~2.4), and Mountain View (~2.5).
FBI Crime Data Explorer filings, CA DOJ OpenJustice tables, and individual local PD annual reports converge on the same general top tier year after year. PPIC’s regular California crime trends analyses have flagged the persistent California pattern: the lowest violent-crime cities cluster in three regions – South OC, the SF Peninsula, and the Sacramento growth ring suburbs.
The honesty caveat I keep coming back to: California has had reporting gaps since several large agencies migrated to NIBRS on different timelines after 2021, which PPIC has documented. The number you see on a website is a snapshot, not gospel; the FBI itself flags certain agencies as “limited data” in given years. When in doubt, cross-reference local PD’s own annual report.
California cities with lowest property crime rate 2026
Property-crime-per-1,000 produces a slightly different map than violent-crime – the Bay Area, in particular, ranks worse on property crime than on violent crime, largely because of car break-ins. The lowest property-crime California cities per recent FBI CDE filings include: Mission Viejo, Aliso Viejo, Rancho Santa Margarita, Yorba Linda, Irvine, Lake Forest, Coronado, Hillsborough, Atherton, Los Altos, Saratoga, Hermosa Beach, Manhattan Beach, Foster City, San Marino, Piedmont, Murrieta, Folsom, Encinitas, and Carlsbad.
The Reddit truth on r/sanfrancisco, r/oakland, r/AskLA, and r/sandiego is that “property crime” in California means car break-ins more than burglary in 2024-2025. SF Chronicle and KQED coverage shows SF auto-burglary numbers declining from the 2022 peak but still elevated; LA and Oakland show similar patterns. The city-level number can be deceptive; the per-neighborhood number is more useful.
For queer residents, the practical advice is the same regardless of orientation: don’t leave anything visible in your car, anywhere in California, and especially not in Bay Area or downtown LA street parking. The number of r/bayarea threads on this is genuinely funny – it’s the most-discussed civic topic in the region.
Lowest crime rate cities in California 2026
Combining violent and property crime into a single composite metric (which is what most “lowest crime rate” lists actually do) produces a top tier consistent across multiple sources: Mission Viejo, Irvine, Aliso Viejo, Rancho Santa Margarita, Yorba Linda, Lake Forest, Carlsbad, Foster City, Saratoga, Cupertino, Thousand Oaks, Sunnyvale, Folsom, Encinitas, Murrieta, and Palo Alto.
FBI UCR top-100 safest large U.S. cities lists routinely include Irvine, Thousand Oaks, Sunnyvale, and Mission Viejo from California. SafeWise and Niche annual rankings produce overlapping lists with similar methodology and similar results. Reddit’s r/california, r/AskLA, and r/orangecounty threads about “lowest crime in CA” cycle through the same names.
For queer readers parsing these rankings, the methodological caveat matters: composite rankings rarely fold in hate-crime context, and California’s AG hate-crime annual report shows anti-LGBTQ+ bias incidents at multi-year highs, with anti-trans incidents climbing year over year. A “lowest crime rate” city can still have hate-incident concerns; cross-reference HRC MEI scores and local Pride org reporting.
California cities with lowest homicide rate 2026
California’s homicide rate has historically run lower than the U.S. average per PPIC analyses, and within California, the cities with the lowest homicide rates over the past five years per CA DOJ OpenJustice include: Irvine, Mission Viejo, Aliso Viejo, Rancho Santa Margarita, Yorba Linda, Carlsbad, Encinitas, Foster City, Saratoga, Los Altos, Cupertino, Palo Alto, Mountain View, Coronado, Manhattan Beach, Hermosa Beach, Folsom, Davis, San Luis Obispo, Thousand Oaks, and Sunnyvale. Several of these cities post zero or single-digit homicides in a typical year.
The data caveat: homicide is a low-base-rate event, and small-city homicide rates per 1,000 are statistically noisy. PPIC and CalMatters have both written carefully about why per-capita homicide is more meaningful in cities over 100,000. For very small cities, the absolute number matters more than the rate.
For queer readers, an underrated FBI CDE data point is bias-motivated homicide; California’s anti-LGBTQ+ homicide events remain rare in absolute numbers per the CA AG hate-crime report, but the broader context of rising anti-LGBTQ+ bias incidents (per FBI hate-crime stats and CSUSB Center for the Study of Hate and Extremism) is worth holding alongside the city-level homicide numbers.
Safest cities in California by FBI crime data
The FBI’s Crime Data Explorer is the closest thing to an authoritative source for U.S. city crime statistics, but it has well-documented limitations in California. Several large CA agencies (including LAPD, SFPD, and others) migrated to the FBI’s NIBRS reporting standard on different timelines starting in 2021, which created reporting gaps for 2021-2023 in some city profiles. PPIC has done careful analysis of this; CalMatters has covered it in plain language.
Per the most recent fully-reported FBI CDE data (typically 2023 with some 2024 partial), the California cities consistently in the FBI’s top tier of safest large U.S. cities (population over 100,000) include: Irvine, Thousand Oaks, Sunnyvale, Murrieta, Roseville, Carlsbad, Fremont (typically), Mission Viejo (just under threshold but worth flagging), and Folsom (also just under).
The honest take for readers: don’t take any single year’s FBI CDE number as gospel. Cross-reference with the local PD’s annual report (most California cities publish them publicly), CA DOJ OpenJustice, and at least one rolling-multi-year average. The cities that show up in the top tier across multiple years and multiple data sources – Irvine, Thousand Oaks, Mission Viejo, Carlsbad, Folsom – are the ones with the most credible “safest” claim.
By Climate / Environment
Safest cities in California with good weather
California’s “good weather” reputation does most of the heavy lifting in San Diego and the Central Coast – the coastal stretch from San Diego up through Santa Barbara to San Luis Obispo posts mild, low-variability weather year-round per NOAA climate data. Within that band, the safest cities with the best weather are: Coronado, Carlsbad, Encinitas, La Jolla and parts of San Diego, Solana Beach, Del Mar, Laguna Beach (small but very safe), Newport Beach, Santa Barbara, San Luis Obispo, and Pacific Grove.
The Reddit consensus on r/SameGrassButGreener and r/AskLA “best CA weather” threads is that the SD coastal cities and the Santa Barbara to SLO stretch are the gold standard. KPBS and the San Diego Union-Tribune have covered this extensively – “perfect weather” is genuinely a San Diego brand, and the data backs it.
For queer readers, San Diego (Hillcrest/North Park – HRC MEI 100, large queer community) and Long Beach (HRC MEI 100, technically southern LA County weather but very mild) lead the “good weather + queer-strong + safe” intersection. Palm Springs has hot summers but spectacular winters; the LGBTQ+ community there is one of the densest in the western U.S. per Williams Institute data.
Safest cities in California with low wildfire risk
Wildfire risk has become the California climate variable that most determines insurance availability and long-term property values. Per Cal Fire’s Fire Hazard Severity Zone (FHSZ) maps and the USGS wildfire risk data, the safest California cities with the lowest wildfire risk cluster on the coast and on the urban interior plain: Coronado, San Diego (most neighborhoods – some east-county communities have higher risk), Carlsbad, Encinitas, Long Beach, Santa Monica, Manhattan Beach, Hermosa Beach, Redondo Beach, Irvine (mostly), Pasadena (with caveats – the foothills are higher risk), Foster City, San Mateo, and parts of Oakland and Berkeley away from the hills.
The cities to be more cautious about for fire risk include Truckee, parts of Sonoma and Napa counties, much of the Sierra foothill zone (Paradise, Magalia, Grass Valley, Nevada City), and the wildland-urban interface zones in Berkeley/Oakland hills, Pasadena’s San Gabriel-adjacent neighborhoods, and many Wine Country communities. CalMatters 2024-2025 reporting on insurance non-renewals in those zones has been comprehensive and a little grim.
For queer readers in fire-prone regions, the practical implications are the same regardless of orientation, but the community-rebuilding context matters.
After the 2017 Tubbs Fire and 2018 Camp Fire, LGBTQ+ residents reported uneven experiences with disaster-recovery infrastructure per local press coverage; California state law (FEHA, etc.) protects against discrimination in insurance and housing, but the lived experience post-disaster can be uneven. Verify any city’s recent insurance non-renewal rate before buying.
Safest cities in California with low earthquake risk
“Low earthquake risk in California” is relative – the entire state has nontrivial seismic risk per USGS data – but some areas have measurably lower risk than others. The lowest-risk California regions per USGS National Seismic Hazard Maps are the far northeast (Modoc, Lassen counties), parts of the northern Sacramento Valley, and the southeastern desert (parts of Imperial County, away from the major faults).
Cities with relatively lower earthquake risk include Redding, Chico, Yreka, El Centro (with caveats – it’s near the Imperial Fault), and parts of the inland Sacramento Valley.
The cities with the highest earthquake risk are concentrated around the San Andreas, Hayward, and Calaveras faults – SF, Oakland, Berkeley, San Jose, the entire Hayward-Fremont corridor on the East Bay, and parts of the Inland Empire on the San Andreas trace. KQED’s 2024-2025 coverage of the Hayward Fault has been particularly clear-eyed about the long-term risk.
For LGBTQ+ readers picking a city partly on earthquake risk, the trade-off is real: the lowest-earthquake-risk California regions tend to have thinner queer institutional infrastructure (Redding, Chico, El Centro). The strongest queer-community cities (SF, Oakland, Berkeley, Long Beach, San Diego) are in higher-risk seismic zones. There’s no clean way to optimize for both; most queer Californians I know take the queer infrastructure and prepare a go-bag.
Safest inland cities in California
California’s inland safety map breaks into three zones: the Central Valley (mixed – higher violent crime in the big cities, much lower in the suburbs), the Inland Empire (similar pattern – safe in Eastvale, Chino Hills, Murrieta, Temecula, Yucaipa, Redlands; less so in San Bernardino, parts of Riverside), and the Sacramento Valley/Sierra foothills (generally safer – Davis, Folsom, Roseville, Rocklin, Truckee). The safest inland California cities per CA DOJ OpenJustice are: Folsom, Davis, Rocklin, El Dorado Hills, Granite Bay, Loomis, Roseville, Eastvale, Chino Hills, Murrieta, Temecula, Yucaipa, Redlands, and Truckee.
The Reddit truth on r/Sacramento, r/InlandEmpire, and r/california is that the inland safest-cities map is heavily about which suburb you pick, not which city. Sacramento Bee and Press-Enterprise reporting confirms the suburb-by-suburb pattern. Heat is the underrated variable – Folsom, Eastvale, Murrieta, and Temecula all post 100°+ summer temperatures regularly, which has real implications for utility costs and long-term livability.
For queer inland life, Davis, Folsom, Sacramento, and Palm Springs (technically Coachella Valley, not “Inland Empire” colloquially but in Riverside County administratively) lead. r/CaliforniaTrans threads about inland California are honest about the patchwork of welcoming and less-welcoming areas; the state-level legal floor (FEHA, SB 107, AB 1955) applies everywhere, but municipal infrastructure is thinner in many inland cities than it is on the coast.
Safest coastal cities in California
California’s safest coastal cities cluster in three stretches: the San Diego coast (Coronado, Carlsbad, Encinitas, Solana Beach, Del Mar, La Jolla), the South Bay/LA coast (Manhattan Beach, Hermosa Beach, Redondo Beach, parts of Santa Monica and Long Beach), and the Central Coast (Pacific Grove, Carmel, Cambria, Cayucos, Pismo Beach). Per CA DOJ OpenJustice, all of these consistently report violent-crime rates per 1,000 below 2.5, with several below 1.5.
Surfrider and California Coastal Commission data on coastal access and water quality fold into the broader “is this a good coastal city” question. KQED and the SD Union-Tribune have ongoing coastal-erosion and sea-level-rise coverage worth reading – the long-term coastal city safety question is partly about climate adaptation, not just crime.
For queer coastal life, Long Beach, San Diego (Hillcrest/North Park-adjacent), Santa Monica, and West Hollywood (technically inland but coast-adjacent) lead the “safe + queer + coastal-or-near-coastal” tier. Encinitas, Carlsbad, Pacific Grove, and Carmel have smaller but visible queer communities; the institutional infrastructure is thinner outside the bigger queer hub cities.
By Amenities / Quality of Life
Safest cities in California with best schools
The “safest + best schools” California shortlist overlaps heavily with the family-cities list and is dominated by Irvine, Palo Alto, Cupertino, San Marino, La Cañada-Flintridge, Piedmont, Manhattan Beach, Pleasanton, Davis, Carlsbad, and parts of Walnut Creek and Lafayette. Per GreatSchools ratings cross-referenced with U.S. News best high schools and FBI CDE crime data, these cities consistently land in the top tier of California family destinations.
The Reddit reality check on r/AskLA, r/bayarea, and r/orangecounty parenting threads is unanimous: the school-pressure-cooker culture in Palo Alto, Cupertino, Irvine, and San Marino is real and is documented in Palo Alto Online and Mercury News coverage going back over a decade. The trade-off between top-tier academics and student mental health is a genuine local conversation, not a stereotype.
For queer parents, school district policy compliance with AB 1955 (the SAFETY Act) and active trans-student support practices vary even among top-academic districts. Long Beach Unified, Pasadena Unified, Davis Joint Unified, Berkeley Unified, San Francisco Unified, Santa Monica-Malibu Unified, and Sacramento City Unified have publicly available trans-student guidelines and active implementation per district-published documents and GLSEN California tracking.
Safest cities in California with best healthcare
Healthcare-quality California cities cluster around major hospital systems: San Diego (Scripps, Sharp, UCSD Health, Rady Children’s), the Bay Area (UCSF, Stanford, Kaiser, Sutter), Los Angeles (UCLA Health, Cedars-Sinai, USC Keck, Children’s Hospital LA), Sacramento (UC Davis Medical Center, Sutter, Mercy, Kaiser), and Orange County (Hoag, UC Irvine Health, Children’s Health of OC). The safest cities within each region for healthcare access are Carlsbad, Encinitas, La Jolla, and Coronado (SD); Palo Alto, Mountain View, Walnut Creek, San Mateo (Bay); Pasadena, Long Beach, Beverly Hills (LA); Davis and Folsom (Sacramento); and Irvine and Newport Beach (OC).
U.S. News Best Hospitals rankings, KFF California-specific data, and CalMatters healthcare reporting all flag the same broad map.
The cities to be more careful about are the rural Northern California counties (Modoc, Lassen, Trinity) and parts of the Inland Empire and Central Valley where hospital closures and provider shortages have been documented; CalMatters Health has covered the rural-hospital crunch extensively.
For queer healthcare access, the strongest combinations of safe + LGBTQ+-affirming providers are San Diego (UCSD’s Mosaic Health, Scripps gender programs), SF Bay Area (UCSF Gender Affirming Health Program, Lyon-Martin, Magnet, Kaiser SF), Los Angeles (LA LGBT Center’s Anita May Rosenstein Campus, Children’s Hospital LA Center for Transyouth Health), Long Beach (The LGBTQ Center Long Beach navigation, MemorialCare), Palm Springs (Eisenhower Health, DAP Health), and Sacramento (Sacramento LGBT Center, Kaiser Sacramento gender programs).
Safest cities in California with low traffic
“Low traffic” in California is mostly a mid-sized-city or suburb story; the big metros (LA, SF, San Diego, San Jose) all rank near the top of national traffic-congestion lists per INRIX and TomTom annual traffic-index reports. Within California, the safest cities with materially lower traffic are: Davis, San Luis Obispo, Folsom, Carlsbad (outside peak commute), Encinitas, Coronado, Walnut Creek, Pleasanton, Truckee, Mission Viejo (Toll Road access helps), and Palm Springs.
The Reddit truth on r/AskLA and r/bayarea is that LA and Bay traffic is uniformly bad – the question is which neighborhood lets you minimize commute time and how often you actually need to drive. KQED and LA Times coverage of post-pandemic traffic patterns has shown some recovery toward 2019 levels but with different peak times and slightly worse weekend congestion in some corridors.
For queer readers, the underrated “low traffic + safe + queer-friendly” combinations are Davis (very bike-friendly, HRC MEI 100), Long Beach (LB Transit serves the queer corridors well), Palm Springs (small enough to be navigable), and Sacramento Midtown (walkable + bike-friendly within the grid). Pasadena’s Old Town and Playhouse District corridors are also walkable enough that you can minimize driving.
Safest walkable cities in California
California’s walkability rankings per Walk Score are led by San Francisco (the most walkable large city in the western U.S.), then the small dense cities (Berkeley, Santa Monica, West Hollywood, parts of Long Beach and Pasadena, Davis), then dense neighborhoods within bigger cities (Hillcrest/North Park in SD, Old Town Pasadena, Belmont Shore in Long Beach, Westwood and Koreatown in LA). Within those, the safest walkable areas (cross-referenced against FBI CDE) are Pasadena (Old Town, Playhouse, South Lake), Santa Monica (north of Wilshire), Long Beach (Belmont Shore, Naples, Bixby Knolls), Davis, Palo Alto (University Ave corridor), and the SF residential walkable neighborhoods (Inner Sunset, Noe Valley, Glen Park).
The Reddit consensus on r/walkable, r/AskLA, r/AskSF, and r/sandiego is that California’s walkable + safe combo cities are a short list: SF residential neighborhoods, Berkeley, Santa Monica, Pasadena, Long Beach (specific neighborhoods), Davis, San Luis Obispo, and Palo Alto. Walk Score data backs the list; Streetsblog California coverage adds the bike-infrastructure dimension.
For queer walkability, the strongest combinations of safe + walkable + queer-strong are West Hollywood (the Boys Town corridor on Santa Monica Blvd is one of the most walkable LGBTQ+ commercial districts in America), Hillcrest (the densest queer walkable neighborhood in San Diego), Castro/Mission/Polk (SF), Lavender Heights (Sacramento Midtown), Belmont Shore and the East Village (Long Beach), and Palm Springs’ downtown.
Safest cities in California with parks and recreation
Parks-and-rec-rich California cities tend to overlap heavily with the affluent, low-crime cities – park investment correlates with municipal tax base. Per the Trust for Public Land’s ParkScore rankings cross-referenced with FBI crime data, the safest California cities with the strongest parks and rec infrastructure include: Irvine (master-planned with extensive park system), Long Beach (extensive city parks plus Shoreline), Pasadena (the Arroyo Seco, multiple city parks, and Brookside), Santa Monica (Palisades Park, multiple city parks plus the beach), San Francisco (Golden Gate Park, multiple regional parks – though the city itself ranks moderately on overall safety), San Diego (Balboa Park is a national-class park, plus Mission Bay, Torrey Pines), Carlsbad, Encinitas, Walnut Creek (Mt. Diablo proximity), and Davis (extensive city greenbelt and bike trails).
TPL ParkScore, CA State Parks, and NPS California units data converge on the same broad map. Reddit threads on r/AskLA, r/sandiego, and r/bayarea about “best parks for kids” or “best dog parks” produce overlapping shortlists of the same cities.
For queer outdoor life, the underrated combinations are Long Beach (El Dorado Park, the bike paths, plus an active LGBTQ+ outdoor community), Palm Springs (hiking access plus an active queer hiking scene per Coachella Valley LGBTQ+ Facebook groups), Sacramento (the American River Parkway), and Davis (greenbelt, bike trails, very queer-friendly). r/QueerHikers and similar Reddit communities map the queer outdoor scene across California fairly comprehensively.
By Specific City Comparisons
Is Irvine the safest city in California?
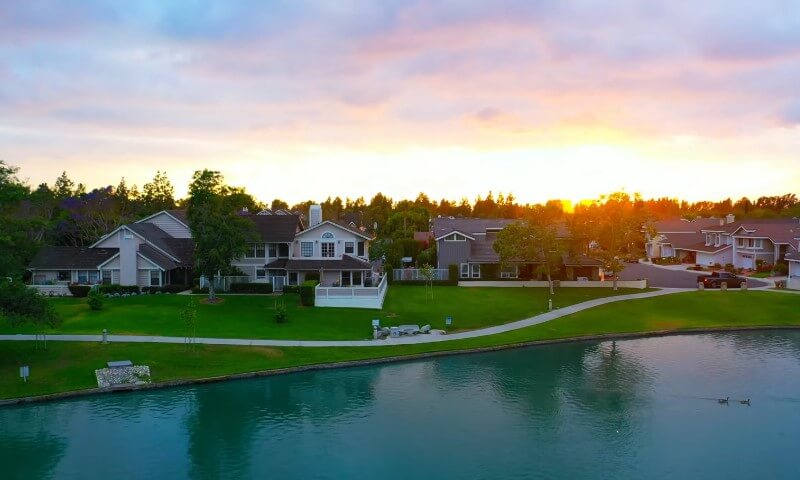
Yes, by most reasonable measures Irvine is the safest large city in California in 2026, and has been near the top of FBI safest-large-cities rankings for nearly two decades. Irvine PD’s reported violent-crime rate per 1,000 has consistently sat below 1.0 – extraordinary for any U.S. city of its size. Per FBI CDE and Irvine PD data, Irvine has typically reported zero or single-digit homicides annually in recent years, with property-crime rates also well below state and national averages.
The Reddit consensus on r/orangecounty is essentially “yes, it really is that safe, and yes, it can feel a little sterile.” The master-planned aesthetic of the Irvine Company’s villages (Quail Hill, Northwood, Woodbridge, Turtle Rock, University Park) is divisive – some people love the order, some find it alienating – but no one disputes the safety data. Daily Pilot and Voice of OC have covered Irvine’s policing approach in detail.
For queer readers, Irvine’s HRC MEI 100 score reflects strong municipal scaffolding – the police department has an LGBTQ+ liaison, the city issues annual Pride proclamations, and Irvine Unified has been notably ahead of many districts on trans-student support per GLSEN California tracking. The lived queer scene is quieter than Long Beach or West Hollywood, but the underlying infrastructure is real.
Safest cities in California vs Texas
California vs Texas comparisons get politically loaded fast, but the data is the data. Per FBI CDE 2023-2024 filings, California’s safest large cities (Irvine, Thousand Oaks, Mission Viejo) post lower violent-crime rates per 1,000 than the safest Texas large cities (Frisco, Plano, McKinney, Round Rock, Sugar Land). However, Texas wins the comparison on cost – the median home price in Frisco or Plano is roughly half of Irvine’s per Zillow. Dallas Morning News and LA Times have both covered the California-to-Texas migration patterns of the past decade.
The Reddit picture on r/SameGrassButGreener, r/CAtoTX, and r/californiamigration is consistently nuanced: Texas wins on cost and certain quality-of-life dimensions; California wins on weather, healthcare access, and outdoor amenities. The crime comparison is closer than headlines suggest – both states have very-safe and very-unsafe cities. Brennan Center data shows neither state’s overall crime trajectory is dramatically out of step with national patterns.
For queer Californians considering Texas, the legal-floor comparison matters more than crime stats. Texas has no statewide non-discrimination protections for sexual orientation or gender identity in employment, housing, or public accommodations; California has all of those (FEHA, Unruh). Texas SB 14 (2023) restricts gender-affirming care for minors; California’s SB 107 specifically positions California as a refuge state. For queer families with kids, the comparison stops being close.
Safest cities in California compared to national average
California’s overall violent-crime rate per 100,000 has historically run somewhat below the U.S. national average, while property-crime patterns have run higher in some Bay Area cities and lower in many Southern California suburbs. Per PPIC and Brennan Center analyses, California’s homicide rate has consistently run below the U.S. average for decades.
The cities that outperform the national average by the widest margins are the master-planned suburbs and Peninsula tech cities: Irvine, Mission Viejo, Aliso Viejo, Carlsbad, Foster City, Saratoga, Cupertino, Palo Alto, and Thousand Oaks all post violent-crime rates that are a fraction of the national city average. FBI CDE data confirms this pattern year after year.
For queer readers, an underrated comparison is hate-crime incidence relative to national average. California’s AG hate-crime annual report shows higher absolute numbers of anti-LGBTQ+ bias incidents than many states, but California also has more rigorous reporting practices and a much larger LGBTQ+ population (per Williams Institute estimates, roughly 5% of California adults identify as LGBT). On a per-capita basis, California is broadly in the middle of the national distribution despite its higher absolute counts.
Most dangerous vs safest cities in California
The gap between California’s safest and most dangerous cities is enormous. The safest cities (Irvine, Mission Viejo, Aliso Viejo) post violent-crime rates per 1,000 below 1.0; California’s higher-crime large cities can post rates 8-12x higher in specific neighborhoods. Per CA DOJ OpenJustice and FBI CDE recent data, the cities consistently ranked higher on violent-crime metrics include parts of Oakland, Stockton, San Bernardino, Compton, parts of Los Angeles (specific neighborhoods only), and Bakersfield (mixed picture).
The honest framing from CalMatters and KQED reporting: California’s “most dangerous” cities are usually being compared on aggregate stats that mask huge intra-city variation. Oakland’s lakeside, Rockridge, Temescal, and Montclair neighborhoods post crime stats much closer to East Bay suburbs than to East Oakland; LA’s Westside and Valley neighborhoods are very different from South LA in the data. The headline number is a starting point, not a conclusion.
For queer readers parsing “dangerous vs safe” comparisons, the additional layer is hate-crime data per the CA AG hate-crime report. Some California cities with low overall crime stats have had specific bias-incident issues; some cities with higher overall crime stats have very strong queer institutional infrastructure that buffers lived risk. The full picture requires both data sets.
Safest cities near Los Angeles
“Near LA” usually means within an hour’s drive of downtown or LAX. Within that radius, the safest cities per FBI CDE and local PD data are: Manhattan Beach, Hermosa Beach, Redondo Beach, Palos Verdes Estates, Rolling Hills, Rancho Palos Verdes, La Cañada-Flintridge, San Marino, South Pasadena, Sierra Madre, Arcadia, Glendora, La Verne, Calabasas, Hidden Hills, Westlake Village, Thousand Oaks (further out, technically Ventura County), Burbank, and parts of Pasadena.
The Reddit reality on r/AskLA “safest LA suburbs” threads is consistent: the South Bay (Manhattan, Hermosa, Redondo, PV), the Pasadena/San Marino/La Cañada cluster, and the West Valley (Calabasas, Hidden Hills, Thousand Oaks/Westlake) form the safest suburban tier. LA Times coverage and LA Daily News reporting confirms the same map.
For queer LA-area life, the safest cities with real queer community combine to a shorter list: Long Beach (technically a city, but LA-adjacent), Pasadena, Burbank, parts of Glendale, Santa Monica, and West Hollywood (the queer anchor). Long Beach in particular keeps coming up as the “queer Pasadena” – lower cost, big community, HRC MEI 100. r/AskLA queer-relocation threads cycle through the same answers.
Safest cities near San Francisco
“Near SF” usually means within an hour’s drive or transit ride. Within that radius, the safest cities per FBI CDE and local PD data are: Foster City, San Mateo, Burlingame, San Carlos, Belmont, Hillsborough, Atherton, Menlo Park, Palo Alto, Los Altos, Mountain View, Cupertino, Sunnyvale, Saratoga, Los Gatos (slightly further), Tiburon, Mill Valley, Sausalito, Larkspur, San Anselmo, Ross, Orinda, Lafayette, Moraga, and Walnut Creek.
The Reddit consensus on r/bayarea and r/AskSF “safest SF suburbs” threads is clear: the Peninsula and Marin lead, with the East Bay’s Lamorinda/Walnut Creek cluster as the strong third option. SF Chronicle and SFGate Bay Area coverage confirms the same broad map. Cost is the consistent caveat – all of these cities have median home prices well above $1.5M, with several above $3M.
For queer Bay Area suburbs, the strongest combinations of safe + queer-friendly are Berkeley (technically a city, but SF-adjacent and HRC MEI 100), San Mateo, Palo Alto, Mountain View, and Walnut Creek (the Rainbow Community Center of Contra Costa County, headquartered in nearby Concord, serves the East Bay). r/bayarea LGBTQ+ relocation threads consistently flag this same shortlist.
By Rankings / Sources
US News
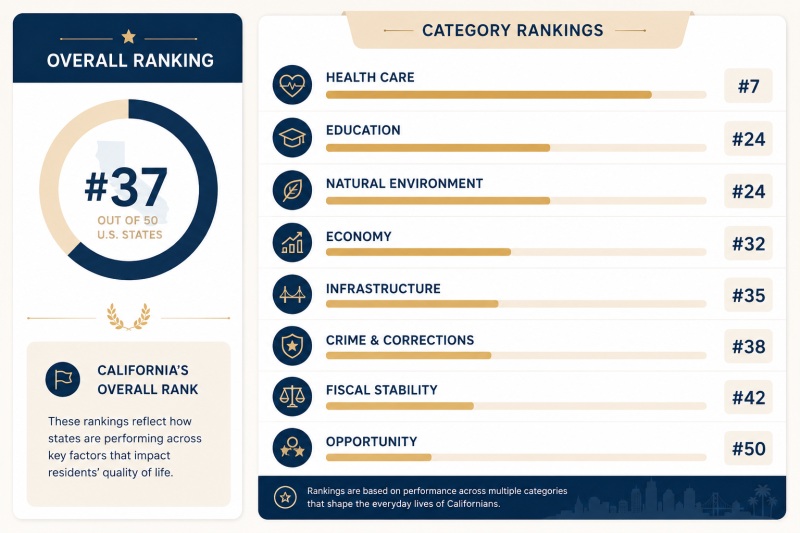
U.S. News & World Report publishes annual rankings using a methodology that combines crime data, quality-of-life indicators, and economic factors. Their California-specific safest-cities rankings have, in recent editions, consistently included Irvine, Thousand Oaks, Mission Viejo, Carlsbad, Roseville, Sunnyvale, Murrieta, Folsom, and Walnut Creek in the top tier. The U.S. News “Best Places to Live” methodology weights schools and amenities alongside crime, which is part of why their top tier overlaps but doesn’t perfectly match a pure FBI CDE crime ranking.
The honest take on rankings methodology: U.S. News, Niche, SafeWise, Livability, and WalletHub all publish California city rankings using overlapping but distinct methodologies, and their top tiers overlap heavily but not perfectly. Reading two or three rankings together produces a more reliable picture than relying on any single one. CalMatters has occasionally published methodology critiques worth reading.
For queer readers, U.S. News rankings don’t currently fold in HRC MEI scores or LGBTQ+-specific quality-of-life indicators, so a U.S. News top-10 California city isn’t necessarily a top-10 California city for queer readers. Cross-referencing with HRC MEI, MAP policy tally, and Williams Institute data is the responsible move – and it usually narrows the list to Irvine, Long Beach, Pasadena, Davis, Walnut Creek, and Carlsbad among the U.S. News-friendly cities.
Safest cities in California ranked by FBI statistics
The FBI’s Crime Data Explorer is the most-cited source for “safest cities” rankings in California, but it should be read with three caveats. First, FBI data is reported by local agencies on a voluntary basis, and California has had reporting gaps since several large agencies migrated to NIBRS on different timelines after 2021 – per PPIC documentation. Second, FBI data lags by 12-18 months from reporting year to publication. Third, per-1,000 rates can be statistically noisy in very small cities.
With those caveats, the California cities consistently in the FBI’s top tier of safest large U.S. cities (population over 100,000) across multiple recent years include: Irvine, Thousand Oaks, Sunnyvale, Murrieta, Roseville, Carlsbad, Fremont (typically), and Folsom (just below the population threshold but worth flagging). Mission Viejo, Aliso Viejo, and Yorba Linda also post very low rates but are below the FBI’s standard population threshold for “large city” rankings.
For queer readers, the FBI also publishes annual hate-crime statistics, which provide a parallel data set worth reading alongside the safest-cities rankings. California reports more total hate-crime incidents than most states, partly because California has more rigorous reporting practices and a larger LGBTQ+ population. The CA AG hate-crime annual report provides more detailed state-level analysis. Together, FBI UCR + FBI hate-crime stats + CA AG report + HRC MEI gives you a fuller “safety” picture than any single ranking.
One more honest closing
If you’ve read this far, you’re either relocating, advising someone who’s relocating, or you’re a fellow Californian like me who can’t help reading these guides. Whichever – thank you. The 50 angles above all point at the same underlying reality: California’s safety story is hyperlocal, full of caveats, and genuinely varied. The cable-news version of “California is dangerous” is wrong; the realtor-listicle version of “California is paradise” is also wrong. The truth is city-by-city, neighborhood-by-neighborhood, and worth your patience.
Save the data sources. Cross-reference at least two. And if you’re queer, trans, or otherwise on the demographic edge of “what ‘safe’ means,” call one local before you sign anything. Most queer Californians I know will pick up on the first ring. We’ve been doing this a while.