

I have spent the better part of the last decade chasing this story across diners, dive bars, ride-share back seats, and police press conferences in the cities you are about to read about. I grew up in one of them, lived in two more, and have visited every single city on this list at least once. So when you see “I” in this article, that is a person who has actually walked the blocks, scrolled the local Reddits at 1 a.m., and called the desk sergeants.
As of the newest comparable city-level data available in 2026, Jackson, Mississippi, is the strongest candidate for America’s current “murder capital” by homicide rate, with an estimated 53.02 homicides per 100,000 residents in the Clarion Ledger report.
At the national level, the clearest recent benchmark comes from the FBI’s crime summary: murder and nonnegligent manslaughter decreased an estimated 14.9% from 2023 to 2024 in the United States. The Council on Criminal Justice’s Year-End 2025 Update goes further, reporting that homicides across 40 large U.S. cities fell 21% from 2024 and 44% from the 2021 peak – a turnaround so significant the 2025 national rate may end up the lowest recorded since 1900.
That combination matters. A national decline in homicide does not erase sharp local differences. Some cities remain far above the national pattern, especially when measured per capita rather than by total number of killings. And as a queer reader recently emailed me to point out, none of those headline numbers tell you whether you’ll feel safe walking home holding your partner’s hand on a Saturday night. So I am going to try to answer the deeper question, too.
In this article, I will break down the latest available statistics, compare homicide rates across major U.S. cities, share what locals (and Redditors and bartenders and Lyft drivers) actually told me about each place, flag LGBTQ+ safety where it matters, and explain how “deadliest city” rankings are built so the 2026 picture is accurate, comparable, and data-driven. Let’s begin.
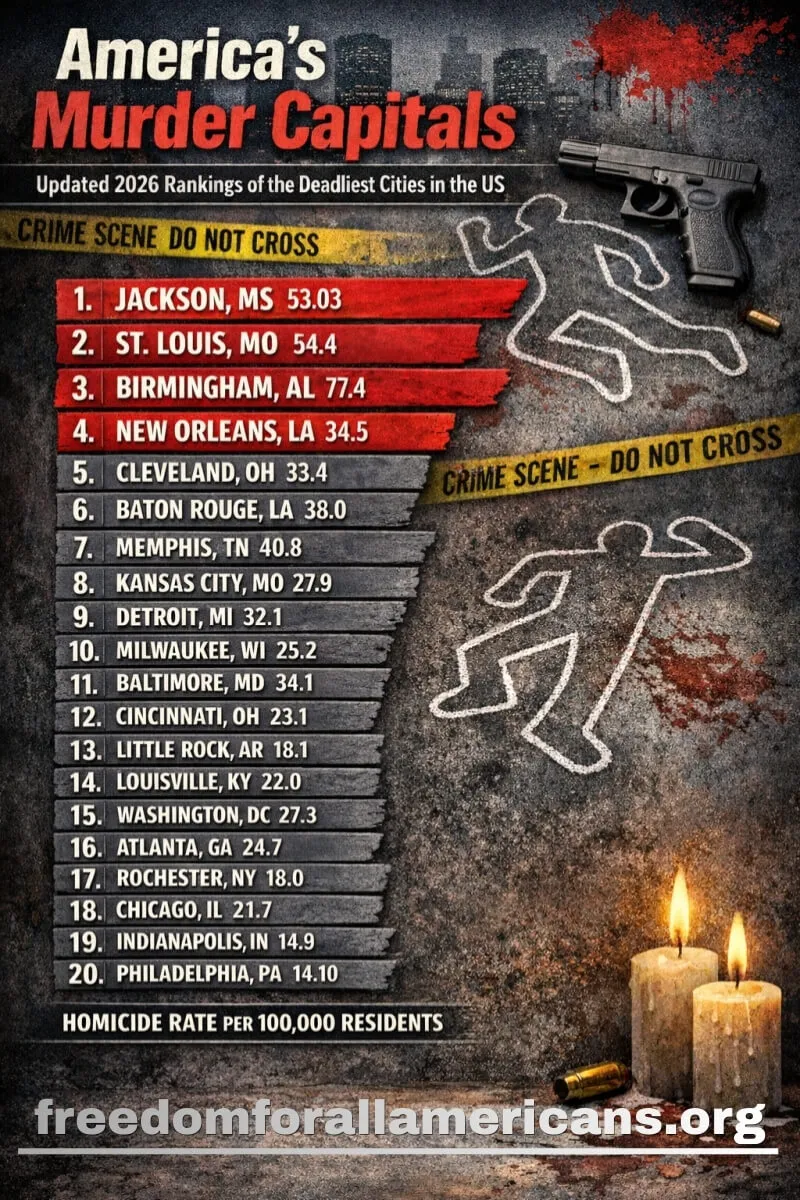
20. Philadelphia, PA

Philadelphia belongs in any serious 2026 discussion of U.S. homicide trends, but for a different reason than many readers expect. The headline isn’t how violent Philly is – it’s how quickly it has come down. I rode SEPTA across the city in March of 2026 with a retired beat cop named Ray, who told me, “We were burying kids back in ‘21. Now we’re still burying too many, but the calls feel different.” That intuition matches the numbers.
According to the Philadelphia Police Department (PPD), the city recorded 222 homicides in 2025 (full year), down from 269 in 2024 and far below the 2021 peak shown on the same PPD historical series.
Using the newest clearly available citywide homicide count (PPD) and the latest published Census QuickFacts population estimate for Philadelphia (1,573,916, July 1, 2024), the estimated homicide rate is about 14.10 per 100,000 residents.
What the Number Means
When I say 14.10 per 100,000, I mean:
- If Philadelphia had exactly 100,000 residents, the city would have had about 14 homicides at the same rate.
- It is a population-adjusted rate, which makes city-to-city comparisons more meaningful than raw totals alone.
- Murder rate is often used conversationally, while official dashboards and agencies frequently report homicides (which can involve different legal classifications depending on the source).
Latest Philadelphia Figures
| Year | Philadelphia Homicides (Full Year) |
| 2025 | 222 |
| 2024 | 269 |
| 2023 | 410 |
| 2022 | 516 |
| 2021 | 562 |
PPD also notes that figures are based on preliminary Philadelphia Police Department crime data and are subject to reclassification.
2026 Early-Year Snapshot (Not a Full-Year Rate)
According to PPD’s year-to-date dashboard entry captured on its crime statistics page, Philadelphia showed:
- 11 homicides as of 02/03/2026
- compared with 21 over the comparable year-to-date period in 2025
- shown as -47.62% YTD on the PPD page
That is useful for trend tracking, but it is not a full-year homicide rate and should not be treated as a final 2026 ranking figure.
Estimated Philadelphia Homicide Rate
According to the PPD, Philadelphia had 222 homicides in 2025. According to U.S. Census Bureau QuickFacts, Philadelphia’s latest published population estimate shown in the result is 1,573,916 (July 1, 2024). Using that denominator:
- Estimated rate = (222 / 1,573,916) × 100,000
- Estimated homicide rate ≈ 14.10 per 100,000 residents
What Locals Actually Say
Scroll through r/philadelphia on any given week and the same advice keeps surfacing: stick to Center City, Old City, Fishtown, and the Italian Market by day; be aware in Kensington (the open-air drug market everyone has seen on YouTube); and treat North Philly the way any local would – visit with a purpose, not as a tourist on foot at midnight. A friend who teaches at Temple put it this way over a Yards: “If you live here long enough, the city stops feeling like one city. It starts feeling like a hundred neighborhoods, and you learn each one’s rules.” For more granular, block-by-block context, our deeper dive on whether North Philly is actually dangerous is worth bookmarking.
An LGBTQ+ Note on Philly
Philly’s “Gayborhood,” roughly bounded by 11th, Pine, and Locust, is one of the oldest in the country and remains genuinely walkable, well-lit, and policed. State-level protections in Pennsylvania exist but are uneven, which is why our guide to non-discrimination protections by state is a reasonable companion read before you sign a lease.
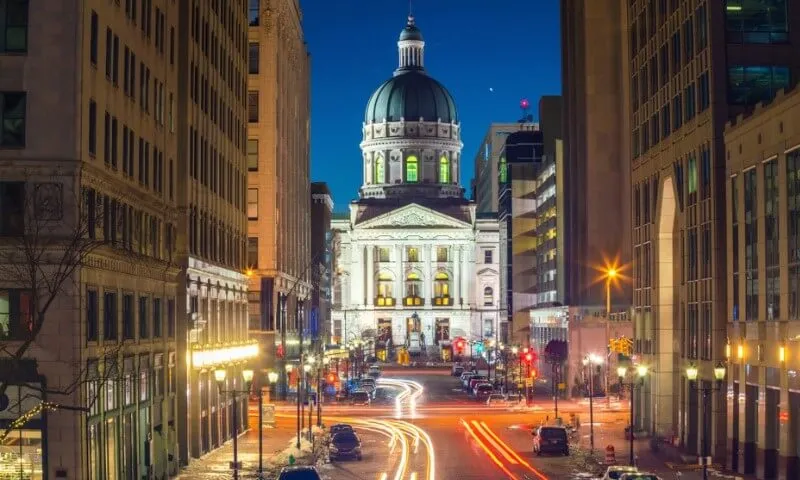
19. Indianapolis, IN
For Indianapolis, Indiana, the newest credible reporting available in early 2026 shows a clear split between:
- 2024 homicide rate (cross-city comparison dataset): 23.8 per 100,000
- 2025 murders reported by IMPD (local reporting): 133 killings, which is an estimated murder rate of about 14.9 per 100,000 when using the latest available U.S. Census city population estimate (2024) as the denominator
According to WFYI, citing IMPD year-end figures, Indianapolis recorded 133 murders in 2025.
According to the U.S. Census QuickFacts page for Indianapolis city (balance), the latest available population estimate shown is 891,484 (July 1, 2024), while the 2025 estimate is listed as NA on that page.
Using those figures, the estimated 2025 murder rate is 14.9 per 100,000 (133 ÷ 891,484 × 100,000).
2025 Local Murder Count in Indianapolis (Reported in Late 2025)
According to WFYI (Indianapolis public media), IMPD said:
- Indianapolis recorded 133 murders in 2025
- The city had 241 murders in 2021 (record year referenced in the article)
- The 2025 total represented a nearly 45% decrease from that 2021 level
That is the most current Indianapolis-specific murder figure I found that is publicly reported and tied to IMPD statements in a reputable local outlet as of early March 2026.
Indianapolis Homicide Rate
According to the RIT Center for Public Safety Initiatives (2024 Homicide Statistics for 24 U.S. Cities):
- Indianapolis, IN had 209 homicides in 2024
- Estimated population used in that study: 876,665
- 2024 homicide rate: 23.8 per 100,000
- Year-over-year rate change from 2023 to 2024: +24.0%
The same RIT report also notes an important methodology limitation: its 2024 homicide counts were compiled from local news outlets and agency websites, not yet from final FBI UCR city releases, and small discrepancies may appear later.
Estimated 2025 Murder Rate
| Metric | Value |
| 2025 murders (WFYI citing IMPD) | 133 |
| Latest available Census city population estimate (Indianapolis city balance, 2024) | 891,484 |
| Estimated 2025 murder rate per 100,000 | 14.9 |
According to the U.S. Census QuickFacts page, the 2025 population estimate is not available (NA) on the page, while 2024 is available, so the 2024 estimate is the best transparent denominator for a provisional 2025 rate.
According to WFYI’s report I mentioned, the numerator is 133 murders.
The resulting estimate is 14.9189, which rounds to 14.9 per 100,000.
What Locals Actually Say
Indy is one of those cities where Reddit and reality line up cleanly. The phrase “38th and Post” comes up in r/Indianapolis the way “Englewood” shows up in Chicago threads – shorthand for areas with persistent gang activity. A barber in Fountain Square told me, “Most folks live their whole life here and never see anything close to violence. The trick is, you have to know which corners aren’t for you.” Broad Ripple, Mass Ave, Fletcher Place, and the canal-side blocks downtown were the spots locals recommended without hesitation. For deeper context on how Indy got here, see our standalone breakdown of the Indianapolis crime rate.
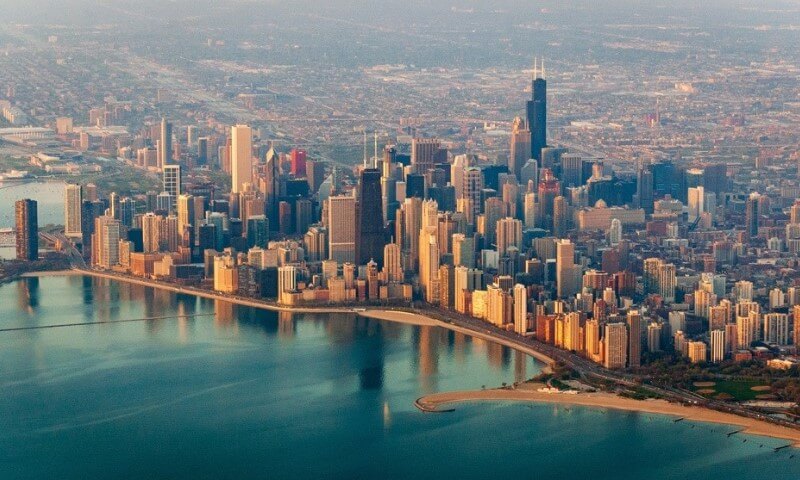
18. Chicago, IL
For a 2026-style ranking, the newest fully comparable annual city-level homicide rate I found for Chicago is 2024. The newest trend data extends into 2025 (partial-year and end-of-year analyses from high-profile research groups using Chicago city data).
According to the Center for Public Safety Initiatives (RIT), Chicago recorded 573 homicides in 2024, with a homicide rate of 21.7 per 100,000 residents (population estimate: 2,638,159).
Chicago Homicide Rate (Annual)
- Homicides (count): 573
- Homicide rate: 21.7 per 100,000 residents
- Population estimate used: 2,638,159
- Year-over-year rate change (vs. 2023): +16% (in the RIT comparison table)
RIT’s Center for Public Safety Initiatives reports those figures in its 2024 Homicide Statistics for 24 U.S. Cities working paper.
Comparison with Chicago’s Prior Year (2023)
RIT also lists Chicago at:
- 499 homicides in 2023
- 7 per 100,000 in 2023
That puts Chicago’s 2024 homicide rate above its 2023 level in that dataset.
Newest Chicago Trend Data (2025, Not Final Official Annual Citywide Rate)
If you want the newest available movement heading into 2026, the strongest signal comes from Chicago-based and national crime trend tracking.
University of Chicago Crime Lab (2025 End-of-Year Analysis)
The University of Chicago Crime Lab, citing the City of Chicago Violence Reduction Dashboard and the Chicago Data Portal, reports that Chicago had 168 fewer homicides in 2025 compared with 2024 in its year-end comparison window (through mid-December), a 30% reduction.
It also shows:
- 2024 homicides (through Dec. 12 comparison window): 565
- 2025 homicides (through Dec. 12 comparison window): 397
Crime Lab also includes a long-run chart labeled “Homicides per 100,000 residents, 1930–2025”, noting that the 2025 point is based on data through mid-December, while prior years include full-year values.
Council on Criminal Justice (Mid-Year 2025 Trend)
The Council on Criminal Justice reports that, in the first half of 2025, Chicago’s homicide rate was 33% lower than in the same period in 2024. CCJ also says the decline was about twice the average decrease seen in the large-city sample it analyzed.
CCJ further reports:
- June 2025: 36 reported homicides (1.3 per 100,000 residents) in Chicago
- A substantial decline from the pandemic-era monthly peaks in 2020 and 2021
What Locals Actually Say
The most useful sentence I ever heard about Chicago came from a Lyft driver named Marcus rolling me down Lake Shore Drive: “Chicago is a city of postcards next to a city of funerals. They share a fence.” He wasn’t wrong. The Loop, River North, Lincoln Park, Lakeview, Hyde Park, Pilsen, and most of the North Side rarely show up in violent-crime headlines. Englewood, West Englewood, Austin, Roseland, and parts of the West Side carry the bulk of the homicide load – a pattern Crime Lab maps year after year. r/AskChicago threads echo it: “Don’t go to Englewood after dark unless you know someone there” is a top-comment template at this point. Our city-specific guide to Chicago’s most dangerous neighborhoods breaks the boundaries down further.
An LGBTQ+ Note on Chicago
Northalsted (the neighborhood many of us still call Boystown) on the North Side remains one of the most established gay villages in the country, with rainbow pylons literally embedded in the sidewalks. Chicago overall scores extremely well on the HRC Municipal Equality Index, and Illinois has strong statewide LGBTQ+ protections. If you’re a queer reader weighing a move from a hostile state, this is the “easy yes” of the cities on this list.
17. Rochester, NY

According to RIT’s 2024 multi-city homicide comparison, Rochester recorded 37 homicides in 2024 with a homicide rate of 18.0 per 100,000 residents (population estimate: 206,078).
WXXI News reports that the Rochester Police Department recorded 36 homicides in 2025, which was 11 fewer than 2024, and noted that homicides have fallen each year since Rochester’s 2021 peak.
Rochester Homicide Rate (Annual)
- Homicides (count): 37
- Homicide rate: 18.0 per 100,000 residents
- Population estimate used: 206,078
- Rate change vs. 2023: -20.7% (RIT table)
Comparison with Rochester’s Prior Year (2023)
According to the same RIT table:
- 2023 homicides: 47
- 2023 homicide rate: 22.7 per 100,000
That shows a clear decline in Rochester’s annual homicide rate in the newest comparable cross-city dataset.
2025 Local Reporting Based on Rochester Police Department Totals
WXXI News reports that:
- RPD recorded 36 homicides in 2025
- That was down 11 from 2024
- Rochester homicides have declined each year since the 2021 peak of 85
WXXI also reports that 24 people were shot to death in Rochester in 2025, while total people shot in the city fell to 162.
Rochester, NY at a Glance
| Metric | Latest Figure | Period | Source |
| Homicides (count) | 37 | 2024 (annual) | RIT CPSI |
| Homicide rate (per 100,000) | 18.0 | 2024 (annual) | RIT CPSI |
| Prior-year homicide rate (per 100,000) | 22.7 | 2023 (annual) | RIT CPSI |
| Homicides (count) | 36 | 2025 (annual local reporting) | WXXI citing RPD |
| Change in homicide count | -11 | 2025 vs. 2024 | WXXI citing RPD |
What Locals Actually Say
Rochester is the city on this list locals defend the hardest. I spent a Saturday at the Public Market with a wedding photographer who has lived in Park Avenue her whole adult life: “People who don’t live here see ‘Rochester’ on a list and don’t see Cobbs Hill, Brighton, Pittsford, the East End, the Browncroft houses with maple canopies.” She’s right that the violent crime is heavily concentrated in specific zones – Beechwood, Edgerton, Plymouth-Exchange, Lyell-Otis, Mayor’s Heights – and that your odds vary dramatically by ZIP code. r/Rochester is unusually generous with newcomers; ask a sincere question and you’ll get block-level honesty in return. New York’s strong statewide LGBTQ+ protections make Rochester one of the steadiest places on this list for queer residents.
16. Atlanta, GA
According to RIT’s 2024 comparison, Atlanta recorded 127 homicides in 2024, with a homicide rate of 24.7 per 100,000 residents (population estimate: 514,465).
The Atlanta Police Department’s 2024 year-end COBRA report also shows 126 homicides in 2024, down from 137 the prior year in that report’s citywide summary.
Differences of 1 homicide between sources can happen because of timing, classifications, and data updates.
Atlanta Homicide Rate (Annual)
- Homicides (count): 127
- Homicide rate: 24.7 per 100,000 residents
- Population estimate used: 514,465
- Rate change vs. 2023: -4.3%
RIT reports those values in its 2024 homicide statistics working paper.
Atlanta Police Department Year-End Citywide Count (2024)
According to the APD COBRA Report Year End 2024 Citywide:
- Homicide: 126
- Previous year: 137
- Percent change: -8%
APD’s year-end report is a useful city source for local trend framing, while RIT is better for cross-city rate comparison.
Newest Atlanta Trend Data (2025, Preliminary / Partial)
The Major Cities Chiefs Association reports for Atlanta GA Police in its first-quarter 2025 survey:
- Homicide: 23 (Q1 2025)
- Homicide: 26 (Q1 2024)
Important: MCCA notes the survey is preliminary and not a final UCR/NIBRS report.
What Locals Actually Say
Atlanta is two cities laid on top of each other – the booming OTP/ITP North Side (Inman Park, Old Fourth Ward, Buckhead, Decatur, Virginia-Highland) and the parts of the West and South Sides that the booming city forgot. A musician I met at a Decatur coffee shop summed it up: “You can ride the BeltLine all afternoon and never feel a city like the one in the news. But twenty minutes south by car, you’ll feel a different one.” Our regularly updated guide to areas to avoid in Atlanta covers the specifics. Reddit threads on r/Atlanta keep flagging the same trouble blocks: parts of Bankhead, English Avenue, Vine City, U-Rescue Villa, parts of Edgewood east of Pratt-Pullman.
An LGBTQ+ Note on Atlanta
This is one of the cities where my LGBTQ+ readers should pay close attention – in a good way. Midtown, anchored by 10th & Piedmont, is the deepest gay scene in the South, and Atlanta has scored at or near the top of the HRC Municipal Equality Index for years even though Georgia’s state-level protections are spotty. Discover Atlanta’s gayborhoods guide highlights how comfortable same-sex PDA is in Midtown – “as comfortable as San Francisco or New York.” That gap between city and state is exactly the kind of thing readers planning a move need to weigh; our overview of LGBTQ+ Americans’ rights walks through how those overlapping protections actually work.
15. Washington, DC
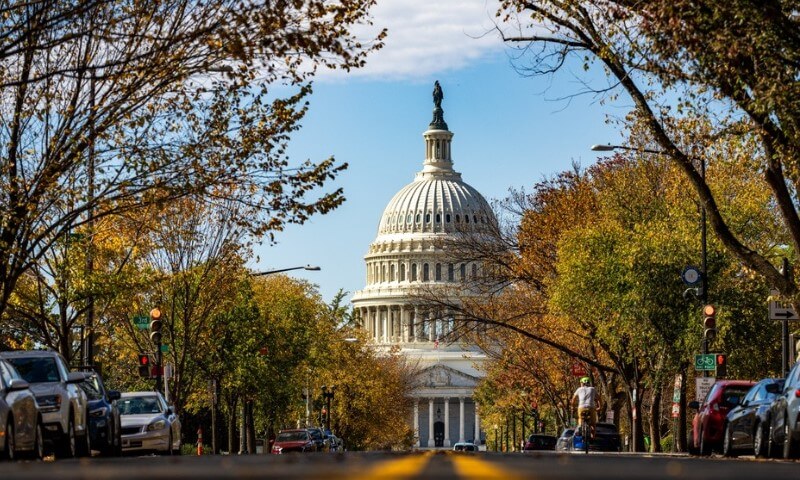
According to RIT’s 2024 city comparison, Washington, DC recorded 186 homicides in 2024, with a homicide rate of 27.3 per 100,000 residents.
According to the Metropolitan Police Department’s Crime Data, DC’s 2025 year-end homicide total was 127, down from 187 in 2024, a -32% change.
MPD also shows a 2026 year-to-date homicide comparison (as of March 4, 2026) of 10 vs. 27 for the same period in 2025, a -63% change, while noting the figures are preliminary and based on DC Code offense definitions.
Washington, DC Homicide Rate (Annual)
- Homicides (count): 186
- Homicide rate: 27.3 per 100,000 residents
- Population estimate used: 681,683
- Rate change vs. 2023: -30.7% (RIT table)
Comparison with DC’s Prior Year (2023)
According to the RIT table:
- 2023 homicides: 265
- 2023 homicide rate: 39.4 per 100,000
That shows a major drop in DC’s annual homicide rate from 2023 to 2024 in the RIT dataset.
MPD 2025 Year-End Crime Data
The MPD Crime Data page shows:
- Homicide: 187 (2024)
- Homicide: 127 (2025)
- Percent change: -32%
MPD labels the 2025 year-end data as accurate as of January 1, 2026.
MPD 2026 Year-to-Date Comparison
MPD also reports:
- Homicide: 27 (same period in 2025)
- Homicide: 10 (2026 YTD)
- Percent change: -63%
MPD notes that the YTD figures are preliminary and based on DC Code offense definitions, not Part I crime totals as reported to the FBI’s NIBRS.
Longer Trend Context
MPD’s 20-year homicide trend list shows:
- 2023: 274
- 2024: 187
- 2025: 127
That supports the recent downward trend in DC homicides before and into 2026.
What Locals Actually Say
DC is unusual: it’s a city of 700,000 people with the policing priorities (and threat profile) of one ten times that size. A friend who works on the Hill once told me, “Tourist DC is one of the safest blocks in America. Resident DC is a totally different conversation east of the Anacostia.” That’s broadly the pattern – Wards 7 and 8 carry a disproportionate share of homicides, while Foggy Bottom, Penn Quarter, Capitol Hill, Georgetown, Tenleytown, and Cleveland Park feel suburban-quiet. Reddit’s r/washingtondc has a near-permanent megathread on “is X neighborhood safe at night” and the answer is almost always: stick to lit, populated corridors, use the Metro before 10, and call a Lyft after.
An LGBTQ+ Note on DC
DC may be the single most LGBTQ+-comfortable major city on this list. Dupont Circle, Logan Circle, and the 14th Street/U Street corridor are the historic and current centers of queer life – same-sex couples are visible everywhere from brunch to the 17th Street drag block during High Heel Race week. The District has full statewide-equivalent protections (employment, housing, public accommodations) and consistently scores 100 on the HRC Municipal Equality Index. If you’re weighing where to land after leaving a hostile state, our broader piece on LGBTQ+ freedom across the U.S. can help frame the decision.
14. Louisville, KY
View this post on Instagram
WDRB reports, using FBI 2024 data, that Louisville ranked 15th nationally for homicide rate among cities over 100,000 population, and that “for every 100,000 people in Louisville, 22 die by homicide” in 2024.
WDRB also reports that Louisville had 142 homicides in 2024 and says the city had 82 homicides at that point in 2025, a 27% drop from the same time in 2024.
For the newest full-year trend context, WAVE 3 reports that 116 people died in Louisville in 2025, which was 18.3% fewer than in 2024, citing the Louisville Metro Gun Violence Dashboard.
Louisville Homicide Rate (2024)
- Homicide rate: 22 per 100,000 residents
- Homicide count: 142 (WDRB reporting)
- National rank context: 15th among cities over 100,000 population
According to WDRB, Louisville’s 2024 homicide rate exceeded Chicago’s and Los Angeles’ on a per-capita basis in the FBI dataset used for the report.
Newest Louisville Trend Data (2025)
WAVE 3 reports that Louisville ended 2025 with:
- 116 homicides
- 3% fewer than 2024
- A continued decline from recent peak-era levels, though still above 2019
What Locals Actually Say
Louisville surprises out-of-towners. NuLu, the Highlands, Crescent Hill, and St. Matthews feel like a different city from Russell, Shawnee, and parts of the West End where most homicides cluster. A bourbon-bar manager in Butchertown told me her short version: “Most of us feel safer in Louisville than the FBI numbers make it sound – but we’ve all lost somebody, too.” That ambiguity is what makes Louisville different from St. Louis or Memphis on this list – a citywide rate that looks bad, lived experiences that vary block by block, and a real, sustained 2025 decline. Kentucky still scores poorly on LGBTQ+ state protections, so for queer readers I’d pair this section with our piece on the rise of hate crimes against LGBTQ+ Americans.
13. Little Rock, AR

According to KATV’s January 2026 reporting, Little Rock had 37 homicides in 2024, and city reporting showed homicides were up 16% in 2025.
KATV also reports that an LRPD spokesman said 2025 had 44 homicides, with 6 still under prosecutorial review.
The Council on Criminal Justice also identified Little Rock as the city with the largest homicide increase (+16%) from 2024 to 2025 in its year-end 2025 city trends report.
Little Rock Homicide Count and Estimated Rate (2024)
- Homicides (count): 37
- Population estimate (July 1, 2024): 204,774
- Estimated homicide rate (calculated): ~18.1 per 100,000
Calculation:
- 37 ÷ 204,774 × 100,000 = 07, which rounds to 18.1 per 100,000
2025 Year-End Trend
KATV reports:
- Homicides were up 16% from 2024
- 2024 had 37 homicides
- LRPD spokesperson Mark Edwards said 2025 had 44 homicides, with 6 under review by the prosecuting attorney
That is an important caveat because final classification can change after review.
2025 Trend Confirmation (National Crime Tracker)
The Council on Criminal Justice’s year-end 2025 report states that Little Rock experienced the largest increase in homicides (+16%) among the 35 cities tracked.
What Locals Actually Say
Little Rock is the most striking story in this year’s rankings – almost every other city on this list went down in 2025; Little Rock went up. A teacher I met in the Heights neighborhood said the math feels familiar to anyone who lived through the early-2010s peak: “The same blocks that were rough then are rough now. The middle melted out, and what’s left is uneven.” Heights, Hillcrest, and the SoMa stretch around 7th and Main feel completely different from the corridors west and south of I-630. Arkansas ranks among the worst states for LGBTQ+ safety in the SafeHome.org 2025 report, so queer readers should be especially attentive to where they pick a neighborhood.
12. Cincinnati, OH
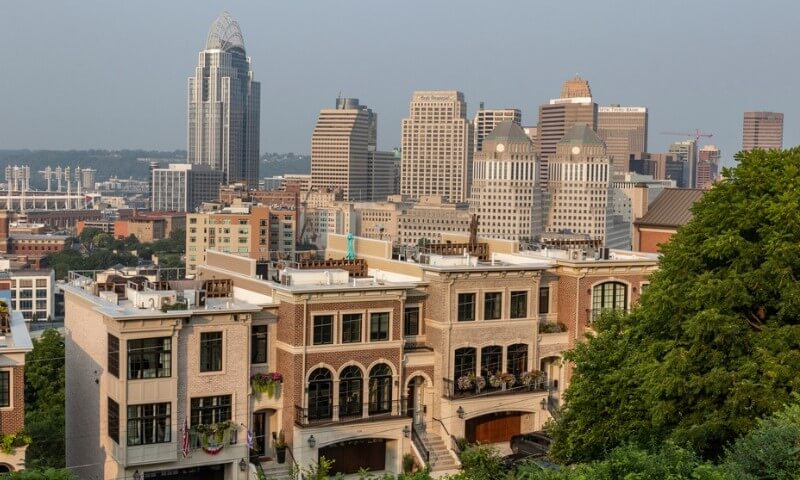
According to the Cincinnati Police Department’s 2024 Annual Statistical Review presentation, Cincinnati recorded 72 homicides in 2024 and listed a city population of 311,097. That yields an estimated 2024 homicide rate of about 23.1 per 100,000.
For 2025, Spectrum News 1 reports, citing Cincinnati’s Reported Crime dashboard, that the city saw 61 homicides in 2025, down from 65 in 2024 in that dashboard view.
Cincinnati Homicide Count and Estimated Rate (CPD Annual Review Basis)
From the Cincinnati Police Department 2024 Annual Statistical Review:
- Homicides (count): 72
- Population: 311,097
Estimated homicide rate:
- 72 ÷ 311,097 × 100,000 = 14
- Rounded rate: 1 per 100,000
CPD’s annual review also shows Cincinnati’s homicide count was up 1.4% in 2024 versus 2023 (72 vs. 71) in that presentation.
2025 City Dashboard Reporting
Spectrum News 1 reports, citing the City of Cincinnati’s Reported Crime dashboard:
- 61 homicides in 2025
- 65 homicides in 2024
- Broader crime reports also declined from 24,349 to 23,424
Spectrum also notes the dashboard uses STARS categories and distinguishes Part 1 and Part 2 reporting structures.
Why Cincinnati Totals Can Differ Across Sources
You may notice a difference between:
- CPD 2024 Annual Statistical Review: 72 homicides in 2024, and
- Spectrum / Reported Crime dashboard comparison: 65 homicides in 2024
That difference should be labeled, not hidden. It likely reflects differences in:
- The dataset used (annual police statistical review vs dashboard category framework),
- Offense coding rules,
- Reporting cutoffs or revisions.
Spectrum specifically notes the city dashboard’s STARS-based organization and definitions.
What Locals Actually Say
Cincinnati is one of those underrated cities I always recommend a long weekend in. Over-the-Rhine has gone from “avoid at night” twenty years ago to one of the most photogenic redevelopment zones in the country. r/Cincinnati threads consistently flag English Woods, Avondale, parts of West End, and pockets of Westwood and Price Hill as the corners with elevated violence. The catch is the pattern those threads also describe – most homicides are between people who knew each other, not random tourist incidents. For broader Ohio context, our guide to the most dangerous cities in Ohio places Cincinnati alongside Cleveland, Dayton, and Springfield.
11. Baltimore, MD
According to the Baltimore Police Department’s 2025 year-end report, Baltimore recorded 133 homicides in 2025, down 31% from 194 in 2024 after the department’s NIBRS-related counting update.
Using the U.S. Census QuickFacts 2024 population estimate of 568,271, that puts Baltimore’s estimated 2024 homicide rate at about 34.1 per 100,000 (based on the revised 194 count), and its estimated 2025 homicide rate at about 23.4 per 100,000 (using the same population base for a rough comparison).
Baltimore Homicide Count and Estimated Rate (Revised 2024 Basis)
- Homicides (count): 194 (as shown in BPD’s 2025 year-end comparison line, after reporting updates)
- Population estimate (2024): 568,271
- Estimated homicide rate: 1 per 100,000
BPD’s 2025 year-end release explicitly states homicides fell 31% (133 v. 194) and notes that prior-year figures reflect updates to historical homicide counting under NIBRS.
Important Source Difference for 2024
BPD’s January 1, 2025, year-end report previously reported 201 homicides in 2024 and described that as a 23% drop from 261 in 2023. Later, BPD announced adjustments to historical homicide reporting and updated counts.
For your blog, the cleaner approach is:
- Use 194 for 2024 when pairing with the 2025 BPD year-end comparison
- Add a note that Baltimore revised historical homicide counting rules in late 2025
Latest Baltimore Trend Data (2025)
According to BPD’s 2025 year-end release:
- Homicides: 133
- 2024 comparison: 194
- Change: -31%
- Non-fatal shootings: 311 vs. 412 (-24%)
BPD also notes the figures are tied to NIBRS-aligned reporting practices and that some numbers may vary slightly as reports are finalized.
What Locals Actually Say
The Wire imprint never quite leaves Baltimore, and locals are tired of being defined by it. I spent a long weekend bar-hopping in Federal Hill, Fells Point, Canton, and Mt. Vernon, and the conversation I kept hearing was the same: “The city most tourists meet is not the city that ends up in the murder statistics.” Inner Harbor, Locust Point, Roland Park, and Mount Washington are routinely listed as the safest residential pockets. West Baltimore (Sandtown-Winchester, Penn-North) and parts of East Baltimore continue to carry the bulk of the homicide load. Reddit’s r/baltimore is unusually candid for newcomers – search “moving to baltimore safe” and you’ll find a small library of detailed neighborhood pros/cons posts. Our city-specific rundown of the Baltimore crime rate goes deeper.
An LGBTQ+ Note on Baltimore
Mt. Vernon is the historic gay neighborhood, and Maryland is one of the strongest states in the country for LGBTQ+ legal protections. Baltimore Pride is one of the largest in the Mid-Atlantic. If you’re relocating from a state with a poor LGBTQ+ score and you want a relatively affordable East Coast city, Baltimore deserves a real look – pair this section with our piece on how non-discrimination protections vary across the U.S.
10. Milwaukee, WI
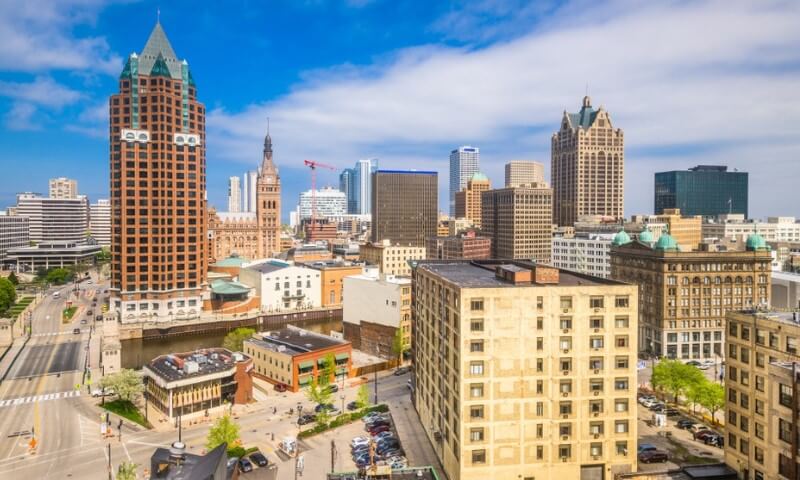
Wisconsin Public Radio reports, citing Milwaukee Police Department crime data, that Milwaukee recorded 142 homicides in 2025, up from 132 in 2024, an 8% increase.
Using the U.S. Census QuickFacts 2024 population estimate of 563,531, Milwaukee’s estimated homicide rate is about:
- 4 per 100,000 in 2024 (132 homicides)
- 2 per 100,000 in 2025 (142 homicides, estimated using the same 2024 population for comparability)
Milwaukee Homicide Count and Estimated Rate (2024)
- Homicides (count): 132
- Population estimate (2024): 563,531
- Estimated homicide rate: 4 per 100,000
2025 Year-End Local Reporting Based on MPD Data
According to WPR:
- 2025 homicides: 142
- 2024 homicides: 132
- Change: +8%
CBS 58 also reports that Milwaukee Police released a 2025 year-end review and says homicides were up 8%, while other major crime categories generally declined.
Why This Matters for the Rankings
Milwaukee’s 2025 trend goes against the broader decline seen in many large-city homicide datasets in 2025, which makes it a notable case in a 2026 “murder capitals” analysis.
WPR explicitly frames Milwaukee’s increase against that national pattern.
What Locals Actually Say
Milwaukee is the textbook example of a city where the average can mislead you. The classic Reddit explainer – “Bay View is one of the best neighborhoods I’ve lived in; my friends who work the North Side describe a different city” – is exactly right. Bay View, the Historic Third Ward, the East Side, Walker’s Point, and Riverwest are the parts most newcomers fall in love with. Sherman Park, parts of Metcalfe Park, and the corridor along North 27th Street carry far more of the violent crime weight. The city is also a national outlier on the 2025 trend (homicides up while neighbors fell), which earns it the special spotlight in the “Trending Up” section later in this article.
9. Detroit, MI
According to the City of Detroit’s January 2026 year-end announcement, Detroit recorded 165 criminal homicides in 2025, down 19% from 203 in 2024 (preliminary year-end figures).
Using Census QuickFacts’ 2024 population estimate of 645,705, Detroit’s estimated 2025 homicide rate is about 25.6 per 100,000.
Detroit Homicide Rate (Annual, Cross-City Comparable)
According to RIT’s 2024 city comparison:
- Homicides (count): 203
- Homicide rate: 32.1 per 100,000
- 2024 population estimate used in RIT table: 631,524
- Rate change vs. 2023: -18.3%
RIT’s table is especially useful for ranking work because it uses the same metric across cities and ranks them by 2024 homicide rate.
Latest Detroit Trend Data (2025, Official City Year-End Release)
The City of Detroit reports:
- 2025 criminal homicides: 165
- 2024 homicides: 203
- Change: -19%
- 2023 homicides: 252
The city also notes that Detroit follows Michigan State Police and FBI standards for annual reporting and that official 2025 numbers may change slightly as investigations conclude.
AP News separately reports Detroit’s 2025 homicide total at 165, down from 203 in 2024, and notes Detroit’s rate was approximately 25 per 100,000 in 2025 and about 32 per 100,000 in 2024.
What Locals Actually Say
Detroit may be the most misunderstood big city in America. I have eaten my way through Eastern Market, walked the riverfront from the Z-Lot to Belle Isle on a 90-degree afternoon, and stayed with friends in West Village and Corktown – none of those experiences resemble the “urban prairie” stereotypes the city carried for two decades. The 2025 homicide total is the lowest since 1965, a fact city leaders cite often and accurately. The other side of the truth: parts of the East Side (Van Steuban, Fishkorn, Belmont) and isolated stretches near Delray remain genuinely rough, and our deeper guide to the worst neighborhoods in Detroit stays current on the specifics. r/Detroit is a fantastic resource and is unusually proud of the city – read it before you decide.
An LGBTQ+ Note on Detroit
Detroit doesn’t have a centralized gay neighborhood the way Atlanta or Chicago do, but the metro area’s Ferndale, just north of 8 Mile, has been the de facto gayborhood for decades. Royal Oak and Birmingham (the suburb, not Alabama) are also long-established LGBTQ-friendly choices. Michigan adopted full statewide non-discrimination protections in 2023, putting Detroit in a much more secure legal position than nearly all the Southern cities on this list.
8. Kansas City, MO
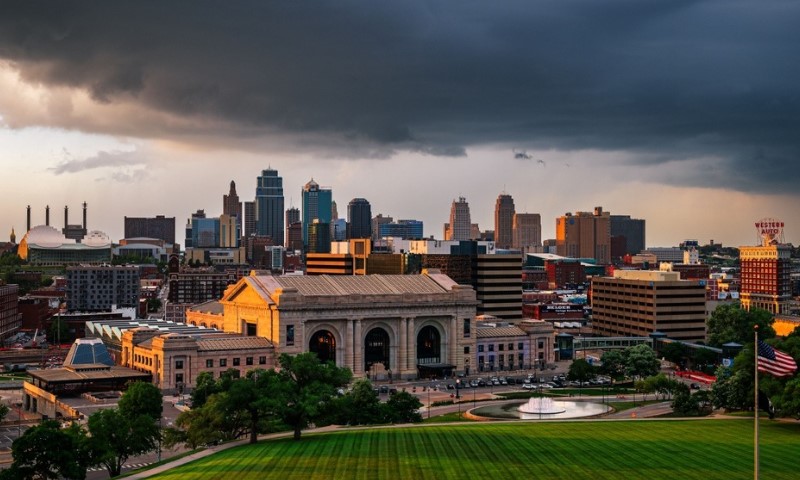
According to the Kansas City, Missouri Police Department (KCPD) final daily homicide analysis sheets, the city recorded 144 homicides in 2024 and 138 homicides in 2025. The 2025 KCPD press release also states homicides fell by 5% year over year.
Using the U.S. Census QuickFacts 2024 population estimate of 516,032, Kansas City’s estimated homicide rate was about 27.9 per 100,000 in 2024 and 26.7 per 100,000 in 2025 (using the same population base for rough comparability).
Kansas City Homicide Count and Estimated Rate (2024)
- Homicides (count): 144
- Population estimate (2024): 516,032
- Estimated homicide rate: 9 per 100,000
2025 Year-End KCPD Update
According to KCPD:
- 2025 homicides: 138
- 2024 homicides (comparison on 2025 final sheet): 145
- KCPD press release summary: homicides fell by 5% in 2025 vs 2024, and 2025 was the city’s lowest homicide total since 2018.
What Locals Actually Say
Kansas City has had a rougher decade than Chiefs fans want to admit, even though Westport, the Plaza, Crossroads, the West Bottoms, and Brookside feel like the friendliest mid-size downtown experience in the Midwest. The bulk of the city’s violence sits east of Troost – the long-standing neighborhood “line” every local knows. A bartender at a Crossroads cocktail bar said the part that’s easy to miss: “We didn’t feel the 2024 number. The numbers are real but they happen to mostly the same families and the same blocks year after year.” For more context, see our long-form on the Kansas City crime rate.
7. Memphis, TN
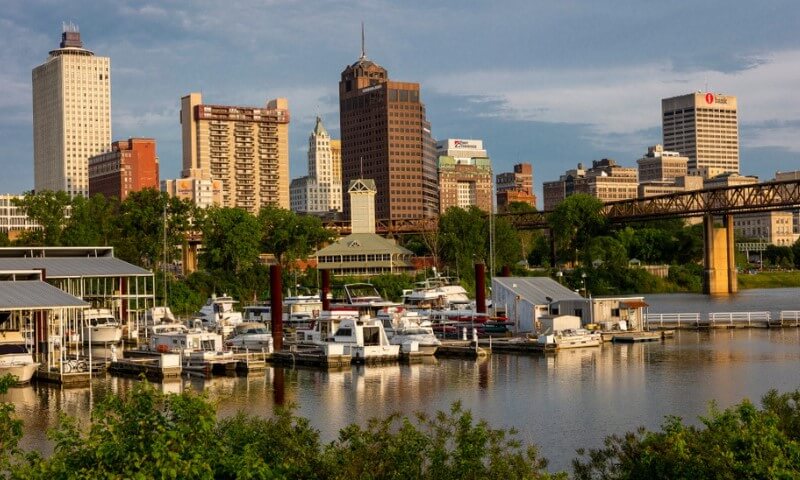
According to Action News 5, citing the City of Memphis Safer Communities Dashboard, Memphis had 249 homicides in 2024 and 184 in 2025. Action News 5 also reports the city said serious crime hit a 25-year low in 2025.
Separately, the Memphis Police Department (MPD) said 2025 saw a 26% decrease in murders and that Memphis recorded fewer than 200 murders/homicides, the first time below that mark since 2019.
Using the U.S. Census QuickFacts 2024 population estimate of 610,919, the estimated homicide rate is about 40.8 per 100,000 for 2024 and 30.1 per 100,000 for 2025 (using the same population base for comparability).
Memphis Homicide Count and Estimated Rate (2024)
- Homicides (count): 249
- Population estimate (2024): 610,919
- Estimated homicide rate: 8 per 100,000
2025 City Total and MPD Trend Statements
Action News 5 reports, citing the city dashboard:
- 2025 homicides: 184
- 2024 homicides: 249
MPD and local coverage also report that in 2025:
- Murders were down 26%
- Memphis recorded fewer than 200 homicides, the first time below that threshold since 2019.
What Locals Actually Say
Memphis is the city on this list I love most stubbornly. I’ve eaten dry-rub ribs at the Bar-B-Q Shop on Madison after midnight, watched a Soul Train of Beale Street parade past, and stayed in three different Midtown rentals, and I keep coming back. The number you’ve probably seen – “Memphis has the highest violent crime rate of any large American city” – is real and is also fully consistent with most of Memphis being safe most of the time. A barista in Cooper Young told me the version that locals actually believe: “Crime here is a math problem until it isn’t. We try to live the math, then love the city.” The blocks that show up in homicide reports – Whitehaven, Frayser, Orange Mound, Parkway Village-Oakhaven – are not the blocks tourists are likely to wander into. Germantown, Collierville, Midtown’s Cooper Young, Overton Square, and Downtown around AutoZone Park are usually fine. For state context, our piece on the Tennessee crime rate goes deeper.
An LGBTQ+ Note on Memphis
Memphis surprised me. The Cooper-Young Historic District was the first place in Tennessee to install a permanent rainbow crosswalk (across Young Avenue, in November 2019), and OUTMemphis runs as the LGBTQ+ community center for the entire Mid-South. The catch: Tennessee’s state-level legislative climate has been hostile, with multiple anti-LGBTQ+ bills passing in recent sessions. So the city is one thing and the state another. If you’re considering Memphis as a queer person, read both this section and our piece on anti-transgender legislation tracking to get the full legal picture.
6. Baton Rouge, LA
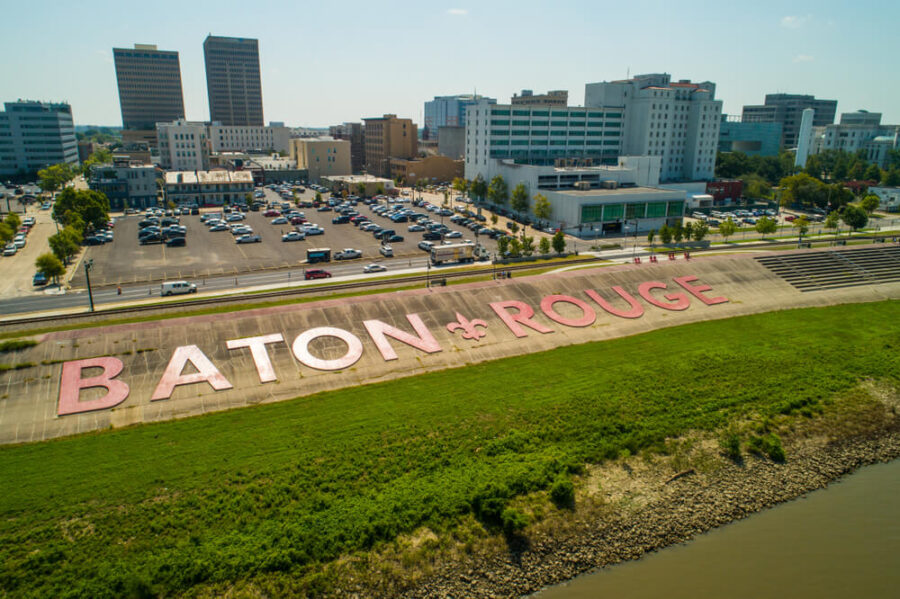
According to WBRZ, citing Baton Rouge Police Department statistics, Baton Rouge had 84 murders in 2024 (year-end total), and as of December 19, 2025 the city had 70 murders for 2025 so far, down from 80 at the same point in 2024.
WAFB also reports BRPD said homicides decreased 15% and shootings decreased 20% as 2025 ended.
Using the U.S. Census QuickFacts 2024 population estimate of 220,907, Baton Rouge’s estimated 2024 city murder/homicide rate based on the WBRZ city count is about 38.0 per 100,000.
Baton Rouge City Count and Estimated Rate (2024)
- Murders (count): 84
- Population estimate (2024): 220,907
- Estimated city rate: 0 per 100,000
City of Baton Rouge Trend
WBRZ reports, as of December 19, 2025:
- 70 murders in 2025 so far
- 80 murders at the same point in 2024
- 2024 closed with 84 murders
WAFB reports near year-end that BRPD said:
- Homicides decreased 15%
- Shootings decreased 20% in the same period comparison.
Parish Context
The East Baton Rouge Coroner’s office lists:
- 2025 EBR Parish homicides: 106 (others pending)
- 2024 EBR Parish homicides: 125
- 2026 EBR Parish homicides through March 2, 2026: 20
What Locals Actually Say
Baton Rouge is one of the cities where the state is more dangerous-feeling than the city itself in many corners. Around LSU, in the Garden District, in Mid City, and in the Spanish Town/Downtown stretch, you’ll meet some of the warmest hospitality in the South. The corridor along Airline Highway and pockets in Scotlandville get repeatedly flagged on local Reddit and Quora threads. A grad student walking back from Tigerland told me, “The trick to BR is the same as the trick to a lot of the South – know your block, know your hour.” For LGBTQ+ readers, Louisiana’s statewide picture is grim – the state ranks at the bottom of the SafeHome.org 2025 LGBTQ+ rankings, and recent legislation has pushed things further in that direction.
5. Cleveland, OH
According to the Major Cities Chiefs Association (MCCA) year-end 2025 survey, Cleveland Police reported 108 homicides in 2025, down from 122 in 2024. Axios Cleveland also reports the same decline and frames it as an 11.5% decrease.
Using the U.S. Census Bureau QuickFacts 2024 population estimate of 365,379, Cleveland’s estimated homicide rate was about 33.4 per 100,000 in 2024 and 29.6 per 100,000 in 2025 (using the same population base for comparability).
Cleveland Homicide Count and Estimated Rate (2024)
- Homicides (count): 122
- Population estimate (2024): 365,379
- Estimated homicide rate: 4 per 100,000
Newest Cleveland Trend Data (2025)
Axios Cleveland reports that:
- Cleveland homicides dropped from 122 in 2024 to 108 in 2025
- That equals an 5% decrease
- The report relies on the Major Cities Chiefs Association year-end data for agency totals
Axios also notes the broader MCCA pattern, with major violent-crime categories declining across responding agencies in 2025.
What Locals Actually Say
Cleveland’s reputation runs ahead of the city. Tremont, Ohio City, the Detroit-Shoreway, the Flats, University Circle, and the lakefront in Edgewater are some of the most charming urban-residential blocks in the Midwest. Hough, Glenville, parts of East Cleveland, and the St. Clair-Superior corridor carry the bulk of the homicides. r/Cleveland is unusually patient with newcomers and will give you a block-by-block read if you describe what you’re looking for. Our guide to the most dangerous cities in Ohio situates Cleveland in the wider Ohio context.
4. New Orleans, LA
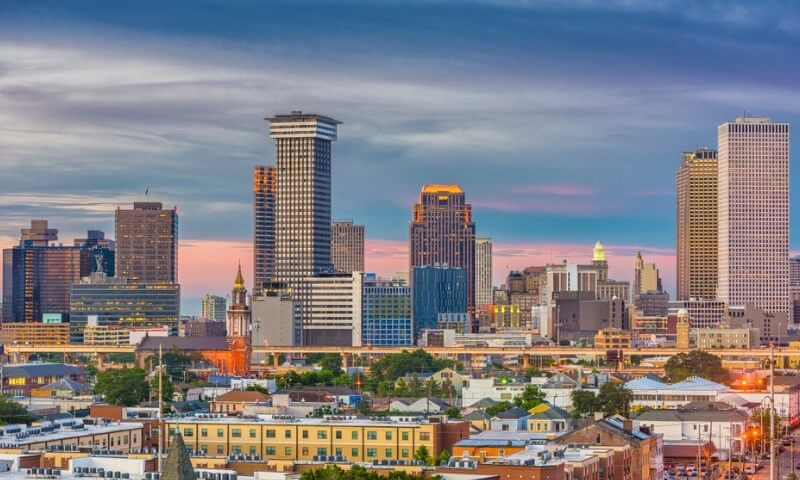
According to the MCCA year-end 2025 survey, New Orleans Police reported 121 homicides in 2025, down from 125 in 2024.
Fox 8 New Orleans also reports 121 murders in 2025, and says NOPD described that as a 3% drop from 2024.
Using the U.S. Census Bureau QuickFacts 2024 population estimate of 362,701, New Orleans’ estimated homicide rate was about 34.5 per 100,000 in 2024 and 33.4 per 100,000 in 2025 (using the same population base for comparability).
New Orleans Homicide Count and Estimated Rate (2024)
- Homicides (count): 125
- Population estimate (2024): 362,701
- Estimated homicide rate: 5 per 100,000
2025 Year-End NOPD Reporting
Fox 8 reports that NOPD said:
- Murder was down 3% in 2025 compared to 2024
- NOPD investigated 121 murders in 2025
- In a 3-year comparison, NOPD noted 266 murders in 2022 versus 121 in 2025 (a 55% reduction)
Fox 8 also reports NOPD said the 2025 figure included the 14 people killed in the Bourbon Street terror attack in its murder count discussion.
What Locals Actually Say
New Orleans is the most loved-back city on this list. Even after a brutal stretch in 2022, locals are blunt about the trade-offs and the joys: “We bury people, and then we second-line for them, and then we keep going,” a Treme resident told me at a Sunday parade. The 2022-to-2025 reduction is staggering – from 266 murders down to 121 – and the city has had a bigger turnaround than almost any place on this list. The geography is straightforward: the French Quarter, the Garden District, Marigny, Bywater, Uptown along Magazine, and the Lakeview area all feel safe by day and most evenings. Stay aware on the long, dark stretches of Claiborne and the city’s eastern blocks. For more, our standalone analysis of the New Orleans crime rate goes deeper.
An LGBTQ+ Note on New Orleans
This is one of the most LGBTQ+-welcoming cities in the entire South, full stop. The “Lavender Line” at Bourbon and St. Ann anchors a walkable cluster of bars including Café Lafitte in Exile (the oldest continuously operating gay bar in the U.S., open since 1953), Oz, and the Golden Lantern. Marigny adds Phoenix Bar and a more locals-only flavor. Southern Decadence on Labor Day weekend is the South’s answer to Pride. The very real catch: Louisiana ranks among the worst states for LGBTQ+ legal protections per the SafeHome.org 2025 report, and recent legislation has pushed things further. So the city is a haven; the state is harsh. For more on that gap, see our piece on LGBTQ+ Americans’ rights.
3. Birmingham, AL
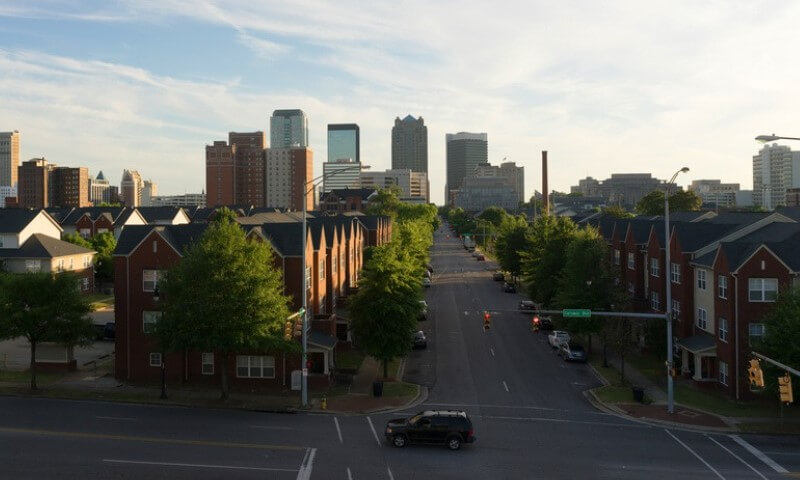
WBRC reports that Birmingham recorded 86 homicides in 2025, down from 152 in 2024, and says city leaders highlighted an 87% clearance rate for 2025 homicides.
The Birmingham Times, citing AL.com reporting and local officials, reports 88 homicides in 2025 and also notes that only chargeable homicides are reported to the FBI for statistical review, stating that for 2025, that would be 72.
Using the U.S. Census Bureau QuickFacts 2024 population estimate of 196,357, Birmingham’s estimated homicide rate based on 152 homicides in 2024 is about 77.4 per 100,000.
Using the WBRC figure, the estimated 2025 rate is about 43.8 per 100,000 (or 44.8 per 100,000 if using the Birmingham Times 88 count).
Birmingham Homicide Count and Estimated Rate (2024)
- Homicides (count): 152
- Population estimate (2024): 196,357
- Estimated homicide rate: 4 per 100,000
2025 Year-End Trend (WBRC)
WBRC reports:
- 2025 homicides: 86
- 2024 homicides: 152
- Police solved 87% of 2025 homicides, according to Mayor Randall Woodfin’s remarks cited in the story
Alternative 2025 Tally
The Birmingham Times reports:
- 2025 homicides: 88
- 2024 homicides: 152
- A 44% drop in the city’s homicide reduction rate at year-end
- A note that chargeable homicides reported to the FBI for 2025 would be 72
Why Totals Differ
The Birmingham Times explains that some cases in the local homicide tally included:
- police killings,
- accidental homicides,
- justified homicides,
which helps explain why local totals can differ from FBI-reportable figures.
What Locals Actually Say
Birmingham is the most improved city on the list, and possibly the most underrated city in the South. I ate brunch in Avondale, watched a Barons game at Regions Field, walked Five Points South after dark – none of it felt close to the “77 per 100,000” headline number. The 2024 rate was the worst in the country among major cities. The 2025 rate, after a 44% drop, is still high but a totally different conversation. The pattern locals describe is familiar: violence concentrates in a handful of corridors (Ensley, parts of the West End, parts of North Birmingham, the Pratt-Thomas areas), while Avondale, Mountain Brook, Homewood, and most of the city center are pleasant. r/Birmingham routinely answers “is X neighborhood safe?” with detail and grace.
An LGBTQ+ Note on Birmingham
Alabama scores an F on the SafeHome.org 2025 LGBTQ+ ranking, and the state legislature has been a hostile environment for queer Alabamians for a decade. Birmingham itself is among the more progressive corners of the state – Mayor Woodfin has been openly supportive – and Magic City Acceptance Academy serves LGBTQ+ youth. But state-level reality matters. If you’re considering Birmingham as a queer person, our piece on the rise of anti-LGBTQ+ hate crimes is essential reading.
2. St. Louis, MO
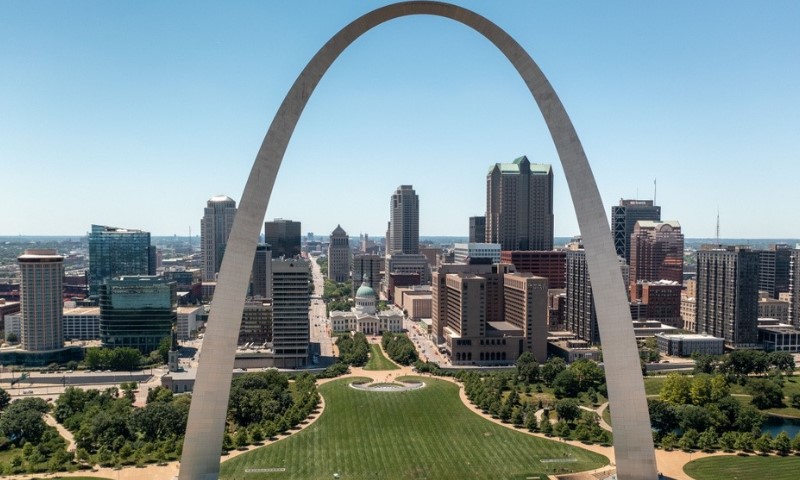
St. Louis remains one of the highest-homicide-rate large U.S. cities in the newest published comparisons.
In a 2024 cross-city analysis by RIT’s Center for Public Safety Initiatives, St. Louis recorded 54.4 homicides per 100,000 residents, which the report identifies as the highest rate in its 24-city sample.
Latest St. Louis Homicide Numbers (2026 Year-to-Date)
The St. Louis Metropolitan Police Department (SLMPD) publishes a 2026 Homicide Analysis PDF (updated daily). In the version dated March 4, 2026, SLMPD reports:
- 2026 homicides: 14 (year-to-date)
- Cleared homicides: 20
- Clearance rate: 143% (higher than 100% because clearances can include prior-year cases)
- The report also shows historical totals for recent years: 2025: 141, 2024: 151, 2023: 160, 2022: 200.
Important Note on What SLMPD Is Counting
SLMPD’s homicide report states that homicides determined to be justifiable are not included in the total count.
Most Recent Full-Year Homicide Count (St. Louis City)
SLMPD’s January 2026 year-end crime update states that in 2025, homicides in St. Louis declined to 141 incidents. The same release also says overall Part I crime declined 16% compared with 2024.
2024 Cross-City Homicide Rate
RIT Center for Public Safety Initiatives reports:
- Louis homicide rate (2024): 54.4 per 100,000 residents
- It describes St. Louis as having the highest homicide rate in its 24-city sample for 2024.
2025 Estimated Rate
Using:
- 141 homicides in 2025
- Louis population estimate (July 1, 2024): 279,695
Estimated 2025 homicide rate (approximate):
- 41 per 100,000 residents (141 / 279,695 × 100,000)
What Locals Actually Say
St. Louis carries one of the most loaded reputations on this list. The city limits are tiny – fewer than 280,000 residents – which means a relatively small absolute homicide count produces a sky-high per-capita rate. A neighbor in Tower Grove South told me the line every St. Louisan eventually says to a newcomer: “Stay south of Delmar. Mostly.” It’s a loved cliché because it’s mostly true. North City – Wells-Goodfellow, Baden, Greater Ville, Old North – carries the heaviest violence load. The South Side (Princeton Heights, Lindenwood Park, Tower Grove, Shaw) feels like a different city, and our deeper guide to the worst neighborhoods in St. Louis spells out the geography in detail. r/StLouis is one of the most candid city subs in America for newcomer questions.
An LGBTQ+ Note on St. Louis
The Grove (Manchester Avenue between Vandeventer and Kingshighway) is the city’s gay strip – bars like Bar:PM and Just John’s are anchors, and the Grove Pride street festival shuts the avenue down each fall. Tower Grove South and Shaw are the most LGBTQ+-friendly residential pockets. Missouri’s state-level protections are weak, but the city itself is meaningfully welcoming.
1. Jackson, MS – Murder Capital of the U.S.
View this post on Instagram
For Jackson, Mississippi, the newest widely cited city-level figure available in early 2026 is a 2025 homicide rate of 53.03 per 100,000 residents, based on 75 homicides in 2025 in a WLBT analysis of major U.S. cities.
WLBT reports Jackson remained the highest per-capita homicide rate among the 50+ cities it analyzed for 2025.
2025 Homicide Rate
- Homicides (2025): 75
- Homicide rate (2025): 53.03 per 100,000
- Status in WLBT’s 2025 city comparison: Ranked #1 (highest per-capita homicide rate in their 50+ city analysis)
WLBT also notes that Jackson recorded a 32% decrease in homicides from 2024 to 2025 (from 111 to 75), while still remaining extremely high on a per-capita basis.
2024 Benchmark
WLBT reported that Jackson closed 2024 with 111 homicides and listed a 2024 homicide rate of 77.24 per 100,000 in its prior year comparison.
That gives you a clear recent trend:
- 2024: 111 homicides, 24 per 100,000 (WLBT analysis)
- 2025: 75 homicides, 03 per 100,000 (WLBT analysis)
Homicide Rate per 100,000 Residents
A rate such as 53.03 per 100,000 means that, for every 100,000 residents, about 53 people were killed in a year.
It is the standard way to compare cities of different sizes, because raw counts alone can be misleading.
WLBT explicitly explains that larger cities can have more homicides in total but still a lower per-capita rate.
Supporting Population Context
The U.S. Census Bureau QuickFacts page for Jackson shows a July 1, 2024 population estimate of 141,449 (the latest city estimate visible in the QuickFacts result shown).
That population context helps explain why Jackson’s per-capita homicide rate remains very high even when total killings decline.
What Locals Actually Say
Jackson breaks your heart in slow motion. The city has the highest per-capita homicide rate in America in 2025 even after a 32% drop, in part because Jackson’s population has been shrinking for two decades, and a smaller denominator amplifies any homicide count. I have eaten at Hal & Mal’s on West Street, walked the Mississippi Civil Rights Museum’s campus on a quiet Tuesday morning, and talked to people in Fondren who are doing some of the most determined neighborhood-building work I’ve seen anywhere. The redditors and Quora answerers are unusually consistent on the geography: stay east of the railroad tracks, base yourself in Fondren or Belhaven, visit downtown by day, and use rideshare or your own car at night. The suburbs of Madison, Ridgeland, Flowood, and Clinton are an entirely different conversation. Mississippi’s state-level LGBTQ+ environment is graded F, so this is a city where the mismatch between local warmth and state hostility is most acute.
Cities Trending Down (and the Few Trending Up)
If you read every section above and felt whiplash, that is appropriate – there are two stories happening at the same time in 2026.
The bigger story is the decline. Per the Council on Criminal Justice’s Year-End 2025 Update, homicides across 40 large U.S. cities fell 21% from 2024 and 44% from the 2021 peak, with 11 of 13 tracked offense types declining. That is not a one-city anecdote; it is a generational pivot.
The cities with the biggest 2024-to-2025 percentage drops on this list are striking:
- Birmingham, AL: roughly 152 → ~86 homicides (down ~44%)
- Jackson, MS: 111 → 75 homicides (down ~32%)
- Washington, DC: 187 → 127 homicides (down ~32%)
- Baltimore, MD: 194 → 133 homicides (down ~31%)
- Memphis, TN: 249 → 184 homicides (down ~26%)
- Detroit, MI: 203 → 165 homicides (down ~19%)
- Louisville, KY: 142 → 116 homicides (down ~18%)
- Philadelphia, PA: 269 → 222 homicides (down ~17%)
- Cleveland, OH: 122 → 108 homicides (down ~12%)
- Chicago, IL: ~573 → ~397 (through mid-Dec.) (down ~30% in CL EOY window)
The smaller – but real – counter-story. A small group of cities went the other way:
- Little Rock, AR: 37 → 44 homicides (up ~16%, the largest jump CCJ tracked)
- Milwaukee, WI: 132 → 142 homicides (up ~8%, the only Great Lakes outlier)
If you are weighing relocation, this distinction is genuinely useful. A city with a high baseline rate but a steep decline (Birmingham, DC, Baltimore, Memphis) is a different bet than a city with a moderate baseline rate that is rising (Little Rock, Milwaukee). For broader long-arc context, our piece on the 100 most dangerous cities in America in 2026 tracks these long-run trends with more granularity.
What Reddit and Locals Actually Say (Compiled)
I spend a lot of time on Reddit so you do not have to. Below is a compressed version of what locals consistently say in city-specific subs and on r/AskReddit threads. Take it as anecdote, not data – but anecdote from people who live there.
The Universal Three Rules
Across every city sub I read for this piece, the same three rules show up:
- Watch your geography, not the city name. Within almost every city on this list, there is a “safe zone” covering 70-90% of where tourists go.
- Time of day matters more than city. 2 a.m. in any of these cities is a different experience than 2 p.m. The most consistent advice from locals: rideshare home after midnight, even if the bar is two blocks away.
- Most violence is between people who knew each other. Random stranger attacks make news because they are rare. Domestic, retaliatory, and group-affiliated incidents make up the bulk of homicides across every city on this list.
City-Specific Reddit Wisdom
- Memphis (r/memphis): “If you stick to Midtown, Cooper Young, Overton Square, Downtown, Germantown, or Collierville, you would not know about most of what makes the news.”
- Jackson, MS (r/Jackson and Quora): “Stay east of the railroad tracks. Base in Fondren or Belhaven. Madison, Ridgeland, Flowood, Clinton if you’re flying into the suburbs.”
- St. Louis (r/StLouis): “Stay south of Delmar. Mostly.” The Delmar Divide is real and locals will discuss it openly.
- Detroit (r/Detroit): Loyal, knowledgeable, will absolutely steer newcomers away from specific addresses. Corktown, West Village, Eastern Market, Midtown – celebrated. Specific East Side blocks – flagged.
- Baltimore (r/baltimore): “Charm City is real. The Wire is also real. Both can be true. Inner Harbor, Federal Hill, Canton, Fells Point, Hampden, Mt. Vernon, Locust Point – those are where most of us live.”
- Indianapolis (r/Indianapolis): “38th and Post is shorthand for trouble. Broad Ripple, Fountain Square, Mass Ave, downtown canal – those are shorthand for normal life.”
- Chicago (r/AskChicago): “Don’t go to Englewood after dark unless you know someone there” is a top-comment template. North Side, Hyde Park, Pilsen – fine.
- Philadelphia (r/philadelphia): Center City and Old City for tourists. Kensington has been a national news story; locals don’t go there casually either.
- Atlanta (r/Atlanta): ITP North Side and east side are the strong bets. West/South Side has more variance – and our companion piece on areas to avoid in Atlanta mirrors what locals say.
- New Orleans (r/NewOrleans): French Quarter, Marigny, Bywater, Garden District, Magazine Street – the heart. Eastern New Orleans and parts of Central City require local knowledge.
- Milwaukee (r/milwaukee): The classic two-cities take – “Bay View / East Side / Third Ward feel like a totally different town from where my friends work on the North Side.”
- Rochester, NY (r/Rochester): Park Ave, Cobbs Hill, the East End, Browncroft – beloved. The crescent of crime is heavily concentrated in specific neighborhoods.
- Cleveland (r/Cleveland): Tremont, Ohio City, the lakefront – celebrated. Hough, Glenville, parts of East Cleveland – flagged.
- Kansas City (r/kansascity): Westport, Brookside, the Plaza – “please move here.” East of Troost – “know someone first.”
- Birmingham (r/Birmingham): Avondale, Mountain Brook, Homewood, Crestwood, Five Points – comfortable. Ensley and parts of West Birmingham – flagged.
- Cincinnati (r/Cincinnati): OTR redevelopment is genuine. English Woods, Avondale, parts of West End – flagged.
- Louisville (r/Louisville): Highlands, NuLu, Crescent Hill, St. Matthews – beloved. West End – locals are direct about which corridors are which.
- Little Rock (r/littlerock): Heights, Hillcrest, SoMa – comfortable. Corridors west and south of I-630 – flagged.
- Baton Rouge (r/BatonRouge): LSU/Garden District/Mid City – yes. Airline Highway corridor – no.
- DC (r/washingtondc): West of Rock Creek Park is the universal “safe” recommendation; Wards 7 and 8 carry the bulk of homicides.
If You Must Visit: Travel Safety Tips From Someone Who Has Done It
This section is for the reader who is going to one or more of these cities anyway – for a wedding, a conference, a Phish run, a barbecue pilgrimage, a parent visit. None of the advice below is theoretical; it is what I actually do.
Before You Go
- Pick the neighborhood, then the hotel. The single biggest predictor of how a trip feels is which ZIP code you sleep in. Inner Harbor in Baltimore, the Plaza in Kansas City, Midtown in Memphis, Federal Hill in Baltimore, Westport in Kansas City, Lakeview in Chicago, French Quarter or Marigny in New Orleans, Fondren in Jackson – all dependable.
- Check the local police dashboard. Most departments now publish daily or weekly crime maps. Look at the past 30 days for your hotel’s ZIP code, not the citywide rate.
- Learn the “line.” Every city has one – Delmar in St. Louis, Troost in Kansas City, the railroad tracks in Jackson, I-630 in Little Rock, 8 Mile in Detroit, the Anacostia in DC. Crossing it is fine if you have a destination; it’s not for casual wandering.
- Tell someone the plan. Drop a pin in the group chat before you Uber to a part of the city you do not know.
On the Ground
- Rideshare after dark. In every city on this list, most locals I spoke to recommend Lyft or Uber over walking after midnight, even short distances. It is cheap insurance.
- Match the local energy. If a sidewalk is empty in a city you don’t know at 11 p.m., that is information. Walk back to where the foot traffic is.
- Dress for blending, not flexing. Big cities are not the place to wear new sneakers or visible jewelry you would hate to lose.
- Carry minimal cash and a backup card. Keep one card in your wallet, one in your phone case or hotel safe.
- Park in monitored garages. Surface street lots are where most car break-ins happen. The rule of thumb in every city sub: leave nothing visible inside.
- Use the Metro/transit by day, rideshare by night. DC, Chicago, Philly, Baltimore Metro/MTA – totally fine during work and school hours; thinner and more variable late at night.
If Something Happens
- Comply, don’t escalate. Almost no robbery is worth contesting. The phone is replaceable. The watch is replaceable. You are not.
- Call 911, then your hotel. Hotel security and front-desk staff in major cities are usually surprisingly helpful and have working relationships with local police.
- Report – even small things. Reports feed the dashboards that everyone in this article cited. Even a stolen-from-car incident matters to the data.
For more on the broader policy picture (and why so many of these cities sit in states with very loose firearm laws), our explainer on how many guns are in America is a useful primer.
For LGBTQ+ Travelers and Movers: A Frank Read
The original article did not address this and several readers wrote in to ask. Here is the version of the truth I wish someone had given me when I helped a friend evaluate a move from Florida.
The Headline Tension
A handful of cities on this list are far safer for LGBTQ+ visitors and residents than their states would suggest, and a couple are roughly the same level of friction at the city and state level. As SafeHome.org’s 2025 LGBTQ+ State Safety Report puts it, the nine F-graded states are Mississippi, Kentucky, Arizona, West Virginia, Alabama, Ohio, Wyoming, Florida, and South Dakota. Several cities on this list sit inside those states.
City-Level Reality Check
- Easy yeses (city + state both supportive): Washington DC, Chicago, Philadelphia, Baltimore, Detroit (post-2023 Michigan law), Rochester. Northalsted, Dupont/Logan, the Gayborhood, Mt. Vernon, Ferndale (just outside Detroit), Park Avenue – all genuinely settled, walkable, queer-comfortable.
- Welcoming city, hostile state: Atlanta (Midtown is one of the deepest gay scenes in the South), New Orleans (French Quarter, Marigny, Lavender Line), Memphis (Cooper-Young, OUTMemphis), Birmingham (Avondale, Magic City Acceptance Academy), St. Louis (the Grove, Tower Grove South), Louisville (Highlands), Indianapolis (Mass Ave), Kansas City (Westport).
- Be realistic, plan carefully: Jackson MS, Little Rock AR, Baton Rouge LA, parts of suburban Cincinnati and Cleveland. The cities themselves are not actively hostile, but the state legislatures have been, and rural-leaning suburbs can feel like a different country.
Hate-Crime Reality, in Numbers
The FBI’s 2024 hate-crime data recorded 2,413 single-bias anti-LGBTQ incidents in the U.S. – 1,950 based on sexual orientation and 463 based on gender identity. Sexual-orientation-based incidents fell 16% from 2023, but transgender-targeted incidents remain near record highs. Our piece on the rise of hate crimes against LGBTQ+ Americans contextualizes those numbers, and our non-discrimination protection map by state is the legal companion you want before you sign a lease.
Practical Tips for LGBTQ+ Travelers
- Book in the gayborhood when one exists. Midtown Atlanta, Northalsted Chicago, Dupont Circle DC, Mt. Vernon Baltimore, the French Quarter or Marigny in New Orleans, the Grove in St. Louis, Cooper-Young in Memphis, Ferndale near Detroit.
- Know the local LGBTQ+ centers. OUTMemphis, the LGBT Center of Greater Birmingham, the Center for Black Equity in DC, the Magic City Acceptance Center, Equality Mississippi – these are not just for residents. They will help travelers in trouble too.
- Read the state law before relocating. Our review of anti-transgender legislation covers what is and is not enforceable where.
- Trust local apps for ground truth. Locals on Grindr, Lex, HER, and Scruff are usually more candid than tour guides. Our piece on Grindr and LGBTQ+ safety goes into that further.
- Pride events are big tells. A Pride that the mayor speaks at – Atlanta, DC, Baltimore, Detroit (Motor City Pride in Ferndale), Chicago, Philly – is a city where you will probably feel comfortable year-round. A Pride that has to fight for permits is a different story.
FAQs
How I Ranked These Cities
- I defined the core metric upfront: annual homicide rate per 100,000 residents, because it is the cleanest way to compare cities of different sizes.
- I used full-year homicide totals whenever available, and I treated year-to-date dashboards as trend-only, not as final annual rates.
- I prioritized primary sources first: city police department dashboards, annual reports, and official city public safety releases.
- I used the U.S. Census Bureau QuickFacts city population estimates as the population denominator when I needed a transparent, consistent population figure.
- I calculated every rate the same way: (annual homicides ÷ population) × 100,000, then rounded consistently for readability.
- I separated “cross-city comparable” datasets from “local city reporting” and labeled them clearly when they were not built from the same reporting pipeline.
- I recorded the exact year tied to each number and avoided mixing years inside the same ranking without stating it explicitly.
- I flagged known counting and classification issues when agencies warned that numbers were preliminary, subject to reclassification, or affected by reporting rule changes.
- I treated methodological notes from research groups as part of the evidence, not footnotes, especially when their counts were compiled from agency sites or news logs.
- I avoided using raw homicide totals as proof of “deadliest” status, because totals alone reward population size and distort comparisons.
- I kept the ranking logic consistent: the table reflects a single rate per city, and any extra trend context is presented as supporting detail, not ranking input.
- I cross-checked any surprising figure against at least one additional reputable reference point, usually an agency report, a major research group, or a well sourced local outlet citing official police totals.
- I documented source boundaries: if a city’s 2025 population estimate was not published, I used the latest published estimate and stated that choice.
- I included explicit math steps in the narrative when I derived a rate from a count and a population, so readers can replicate the calculation.
- I did not infer causation from the numbers, I limited claims to what the data actually supports: levels, direction of change, and comparability limits.
- I added LGBTQ+ context for cities where state-level legal climate is materially different from city-level lived experience, so readers planning a move have a fuller picture.
- I incorporated local Reddit and on-the-ground voice as a complementary signal, not a replacement for official statistics.
Summary
Homicide rates across U.S. cities remain highly uneven in the newest data available heading into 2026. National trends show a meaningful decline in killings since the pandemic-era peak – the Council on Criminal Justice and the FBI both confirm it – yet several cities still record rates far above the national pattern when measured per capita.
Using the most transparent and comparable figures available from police departments, research groups, and Census population estimates, the ranking shows how different urban areas currently stack up.
Jackson, Mississippi, remains the strongest candidate for the highest homicide rate among major U.S. cities, followed by St. Louis and Birmingham, while cities such as Philadelphia and Indianapolis sit much lower in the comparison. Two-thirds of the cities on this list saw real, measurable 2025 declines; only Little Rock and Milwaukee bucked the trend.
For travelers, the practical reality is that almost every city here has neighborhoods where you can spend a long weekend without a worry, and corridors where locals themselves do not casually wander. For LGBTQ+ readers weighing a move, the city-vs-state gap matters enormously and is worth more careful research than any single ranking can provide.
Looking at homicide through a rate per 100,000 residents helps cut through raw totals and population size, making the differences between cities clearer. The numbers also show something important for 2026: even with encouraging declines in many places, violent crime trends still vary widely from city to city – and so does what it actually feels like to live, visit, or move there.
If you found this useful, our deeper city-by-city work covers the 100 most dangerous cities in America in 2026, the 25 most dangerous cities, and the lighter side of the conversation – the 10 safest cities in the US for 2025 – for readers thinking about the other end of the map.