California is home to some of the most crime-ridden cities in the United States, with certain areas consistently reporting high rates of violent and property crime. While the state boasts a large population and diverse urban centers, crime statistics reveal significant safety concerns in specific cities.
After analyzing recent crime data, it’s clear that a few cities stand out for their dangerous environments, posing heightened risks for residents and visitors alike. Oakland definitely stands out as one of the most dangerous, but there are other cities that are important to mention.
Let’s take a closer look.
| City | Key Statistic |
|---|---|
| Berkeley | Violent crime rate: 28.5 per 1,000 residents |
| West Hollywood | Violent crime rate: 37.2 per 1,000 residents |
| Red Bluff | Total crime rate: 74 per 1,000 residents |
| San Francisco | Homicides in 2024: 35 (lowest since 1961) |
| Santa Fe Springs | Violent crime rate: 467 per 100,000 residents |
| Signal Hill | Total crime rate: 60 per 1,000 residents |
| Commerce | Total crime rate: 15,296 per 100,000 residents |
| Barstow | Crime index: 396 (1.6 times U.S. average) |
| Susanville | Total crime rate: 31.23 per 1,000 residents |
| Emeryville | Crime rate: 1,303 per 100,000 residents |
| Modesto | Total crime rate: 33 per 1,000 residents |
| Inglewood | Total crime rate: 36 per 1,000 residents |
| Richmond | Total crime rate: 37 per 1,000 residents |
| Compton | Total crime rate: 38 per 1,000 residents |
| Stockton | 11.6% decrease in reported crimes (2024 vs. 2023) |
| Vallejo | Total crime rate: 52 per 1,000 residents |
| San Bernardino | Total crime rate: 44 per 1,000 residents |
| Fresno | Total crime rate: 44 per 1,000 residents |
| Bakersfield | Total crime rate: 4,519 per 100,000 residents |
| Oakland | Violent crime rate: 1,521 per 100,000 residents |
Table of Contents
Toggle20. Berkeley

According to Berkeley Scanner, this marks a decrease compared to the same period in 2024, which saw 13 shootings, six of which resulted in injuries.
Detailed Breakdown of Recent Incidents
The reported shootings in 2025 occurred on the following dates:
-
March 21: Near Memorial Stadium on Canyon Road, where officers found evidence of gunfire but no victims or property damage.
-
February 9: On University Avenue between Acton and Sacramento streets; details remain limited.
-
January 18: In the 2800 block of College Avenue; initial reports found no evidence, but a subsequent search uncovered signs of gunfire.
-
January 20: At 62nd and King streets, with evidence found a block west at 62nd and California streets.
Comparative Crime Rates
In a broader context, Berkeley’s violent crime rate stands at 28.5 incidents per 1,000 residents, surpassing the national average of 22.7 but slightly higher than San Jose’s rate of 25, as per Best Places.
Property crime is more pronounced, with Berkeley reporting 64.6 incidents per 1,000 residents, nearly double the national average of 35.4 and significantly higher than San Jose’s 36.5.
19. West Hollywood
According to In February 2025, the West Hollywood Sheriff’s Station reported responding to 1,626 service calls, leading to 116 arrests, 31 of which were felonies, WEHOOnline reports.
Community Engagement and Safety Initiatives
West Hollywood’s Safety Ambassadors played a significant role in community engagement during the same period.
They conducted 1,956 hospitality interactions and contacted businesses 3,463 times. Notably, their outreach to unhoused individuals increased by 24% from the previous year, totaling 578 interactions.
Additionally, safety escorts provided by the ambassadors rose to 29 incidents, marking a 200% increase.
Comparative Crime Rates
According to data from 2025, West Hollywood’s violent crime rate stands at 37.2, which is higher than the national average of 22.7 but lower than Chicago’s rate of 49.9.
The property crime rate in West Hollywood is 58.2, surpassing both the national average of 35.4 and Chicago’s rate of 46.3.
18. Red Bluff
Red Bluff, a city in Tehama County, California, has been grappling with significant crime challenges in 2025.
Recent statistics indicate that the city’s crime rate stands at 74 per 1,000 residents, placing it among the highest in the nation.
This means residents face a 1 in 14 chance of becoming a victim of either violent or property crime, a figure that surpasses the crime rates of over 99% of communities within California.
Violent Crime Escalation
The violent crime rate in Red Bluff has reached alarming levels. Offenses such as rape, armed robbery, and aggravated assault are notably prevalent.
According to NeighborhoodScout, the chance of encountering a violent crime in the city is 1 in 82. This is significantly higher than the national median, highlighting the severity of the situation.
Property Crime Concerns
Property crimes, including burglary, larceny, motor vehicle theft, and arson, are also rampant in Red Bluff. Statistics show that residents face a 1 in 16 chance of falling victim to property crime, with a rate of 62 incidents per 1,000 residents.
Particularly concerning is the city’s motor vehicle theft rate, which is among the highest nationwide, with a 1 in 120 chance of vehicle theft.
Comparative Analysis with Neighboring Cities
When compared to nearby cities, Red Bluff’s crime rates are notably higher.
For instance, Redding, located just north of Red Bluff, has a violent crime rate of 50.4 and a property crime rate of 59.8, both of which are lower than Red Bluff’s respective rates of 50.4 and 94.2 as per Best Places.
17. San Francisco
As of April 2025, San Francisco has experienced notable shifts in its crime, reflecting both challenges and progress in public safety efforts.
Decline in Violent Crime
In 2024, San Francisco recorded a significant decrease in violent crime, with homicides dropping to 35 cases—a 31% reduction from the previous year and the lowest since 1961, as reported by Mission Local.
This downward trend extended to other violent offenses, including rapes and aggravated assaults, contributing to an overall 14% decline in violent crime compared to 2023.
Reduction in Property Crime
Property crimes also saw a substantial decline. Auto burglaries, a longstanding concern, decreased by over 50% from 2023 to 2024, reaching a 22-year low.
This improvement is attributed to proactive policing strategies, such as targeted stings and the deployment of technologies like license plate readers and drones.
Targeted Enforcement Efforts
In early 2025, the San Francisco Police Department intensified efforts to address specific crime hotspots.
For instance, along the Sixth Street corridor, officers made 218 arrests within a month, with 124 related to drug charges, as reported by SFGATE.
16. Santa Fe Springs
Santa Fe Springs, California, has experienced significant crime challenges in recent years, positioning it among the more dangerous cities in the state as of 2025.
Analyzing the latest crime statistics reveals notable trends in both violent and property crimes, underscoring the need for continued community awareness and law enforcement efforts.
Overall Crime Rate
In 2023, Santa Fe Springs reported a crime rate of 655 incidents per 100,000 residents, which is approximately 2.7 times higher than the national average.
According to City-Data, this figure marks a 7% increase compared to 2022, indicating a rising trend in criminal activities within the city.
Specifically, the number of homicides rose to nine in 2023, an increase of six from the previous year. Over the past five years, the city has seen a rise in both violent and property crimes.
Violent Crime Trends
Violent crimes, including aggravated assaults, robberies, and homicides, have been particularly concerning. In 2023, the violent crime rate was 467 per 100,000 residents, significantly higher than the national average of 203.4.
The city recorded nine homicides that year, reflecting a troubling increase. Additionally, the assault rate stood at 442.14 per 100,000 residents, further emphasizing the severity of violent crime in the area.
Property Crime Concerns
Property crimes have also surged, with the 2023 rate reaching 699.7 per 100,000 residents, compared to the national average of 155.7.
Motor vehicle thefts were notably high, with a rate of 14.97 per 1,000 residents, indicating that residents faced a 1 in 67 chance of having their vehicle stolen, as per NeighborhoodScout.
15. Signal Hill
Signal Hill, a city in California, has been grappling with significant crime challenges in 2025. The overall crime rate stands at 60 per 1,000 residents, positioning it among the highest in the nation, as reported by NeighborhoodScout.
This statistic translates to a 1 in 17 chance of becoming a victim of either violent or property crime in the city.
Comparatively, more than 98% of communities in California have a lower crime rate than Signal Hill.
Violent Crime Statistics
Violent crime in Signal Hill is notably high, with a rate of 6.76 incidents per 1,000 residents. This includes offenses such as rape, robbery, and aggravated assault.
Residents face a 1 in 148 chance of falling victim to violent crime, a figure that surpasses both state and national averages, statistics show.
Specifically, the city has reported 4 rapes, 22 robberies, and 50 aggravated assaults in the current year.
Property Crime Concerns
NeighborhoodScout also reported that property crimes are a significant concern in Signal Hill, with a rate of 53.34 per 1,000 residents.
This category encompasses burglary, larceny-theft, motor vehicle theft, and arson. The likelihood of experiencing a property crime is 1 in 19.
Particularly alarming is the motor vehicle theft rate, which stands at 15.65 per 1,000 residents, indicating a 1 in 64 chance of vehicle theft.
14. Commerce
Commerce, California, has garnered attention due to its notably high crime rates. As of 2025, the city reported a total crime rate of 15,296 incidents per 100,000 residents, which is 571% higher than the national average, judging by AreaVibes statistics.
Violent Crime Statistics
Violent crimes in Commerce are alarmingly prevalent. AreaVibes reports that the city recorded 1,398 violent crimes per 100,000 residents, a rate 284% higher than the national average.
This category includes offenses such as murder, rape, robbery, and assault. Specifically, the murder rate stood at 34.5 per 100,000 residents, which is significantly above the national average of 6.1.
Robberies were reported at 603.9 per 100,000 residents, and assaults at 716.1 per 100,000 residents, both substantially exceeding national figures, as per Niche.
Property Crime Insights
Property crimes present an even graver issue in Commerce. The city experienced 13,899 property crimes per 100,000 residents, which is 625% higher than the national average, as per statistics. This category includes burglary, theft, and motor vehicle theft.
Notably, burglaries were reported at 2,424.3 per 100,000 residents, thefts at 7,928.6, and motor vehicle thefts at 3,545.9, all significantly surpassing national averages.
13. Barstow
Barstow, a city located in San Bernardino County, California, has experienced notable fluctuations in its crime rates over recent years.
According to City-Data, the city’s crime index was reported at 396, which is approximately 1.6 times higher than the U.S. average, indicating a higher prevalence of crime compared to many other American cities.
This figure, however, represents an 11% decrease from the previous year, suggesting some improvement in public safety.
Violent Crime Trends
In 2023, Barstow’s violent crime rate stood at 463.4 per 100,000 residents, more than double the national average of 203.4, which was also reported by City-Data. This category includes offenses such as aggravated assault, robbery, rape, and murder.
Specifically, there were 2 reported homicides, 12 rapes, 47 robberies, and 154 aggravated assaults during that year, as reported by AreaVibes. While these numbers are concerning, they do reflect a downward trend in violent crimes over the past five years, indicating progress in addressing these issues.
Property Crime Dynamics
Property crimes in Barstow, which encompass burglary, theft, and motor vehicle theft, were recorded at a rate of 338.5 per 100,000 residents in 2023.
Although this rate surpasses the national average of 155.7, it represents a decline compared to previous years. Notably, motor vehicle theft remains a significant concern, with residents facing a 1 in 117 chance of having their vehicle stolen.
#roc Shared from FB@sfj8888 @mcfw @JohnSpaulding @acoffey3216 @barstow_scott @r_heals13 pic.twitter.com/NrdRUSLA1W
— ROCHESTER, NY CRIME, INCIDENTS, NEWS, INFO (@ROCHNYCRIMEINFO) April 9, 2025
Comparative Analysis with Other California Cities
When compared to some cities in California, Barstow’s crime rates are notably higher. For instance, in 2025, Barstow reported a violent crime rate of 57.9, significantly exceeding Sacramento’s rate of 35.6 and the national average of 22.7, as per Best Places.
Similarly, Barstow’s property crime rate was 56.4, compared to Sacramento’s 46.9 and the national average of 35.4. These statistics underscore the relative severity of Barstow’s crime situation within the state.
12. Susanville
Susanville, a city in Lassen County, California, has experienced notable shifts in its crime dynamics as of 2025. According to Crime Grade, the overall crime rate stands at 31.23 incidents per 1,000 residents annually, positioning Susanville in the 31st percentile for safety nationwide.
This indicates that the city is safer than 31% of U.S. cities but less safe than the remaining 69%. Residents face a 1 in 32 chance of becoming a victim of either violent or property crime.
Violent Crime Statistics
Violent crimes, including offenses such as murder, rape, robbery, and aggravated assault, have been a significant concern in Susanville. Crime Grade statistics also show that the violent crime rate is 4.917 per 1,000 residents per year.
Notably, the southeast neighborhoods report higher incidents, with a 1 in 169 chance of residents encountering violent crime, whereas the southwest areas are comparatively safer, with a 1 in 366 chance.
Property Crime Insights
Property crimes, encompassing burglary, theft, and motor vehicle theft, have shown varied trends. AreaVibes reports that the property crime rate is 27.2% lower than the national average.
Specifically, there were 198 property crimes reported, amounting to 1,201 per 100,000 people, which is lower than the national average by 38.6%.
Economic Impact of Crime
The financial ramifications of crime in Susanville are substantial. The projected cost of crime for 2025 is approximately $11.4 million, translating to about $465 per resident and $1,120 per household, as reported by CrimeGrade.
This expenditure represents roughly 1.7% of the median household income in the city. Violent crimes contribute significantly to this figure, with an estimated cost of $6.66 million, underscoring the urgency for effective crime prevention and intervention strategies.
11. Emeryville
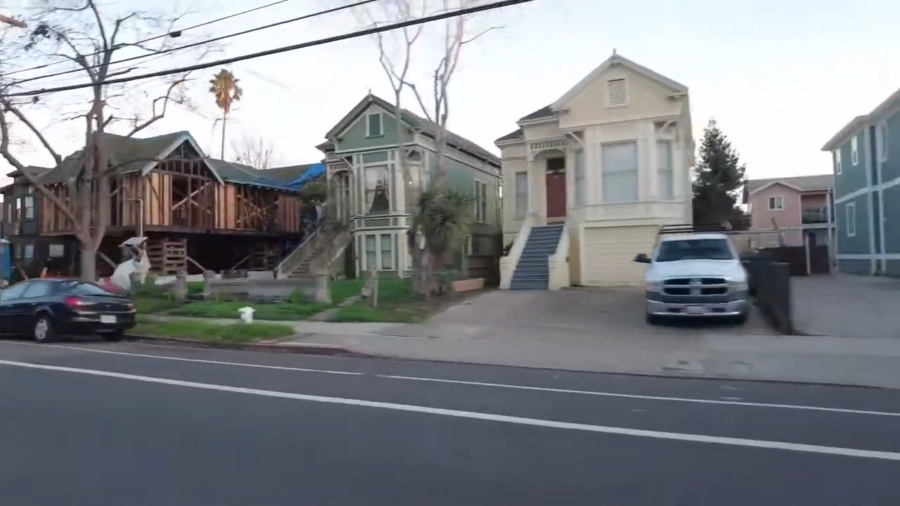
According to City-Data, in 2023, the city experienced a crime rate of 1,303 incidents per 100,000 residents, which is approximately 5.4 times higher than the national average. This marked a 26% increase compared to 2022, indicating a significant upward trend in criminal activity.
Violent vs. Property Crimes
The distinction between violent and property crimes in Emeryville is notable. Violent crimes, including offenses such as murder, rape, robbery, and aggravated assault, have seen fluctuations over the years.
Statistics show that in 2023, the violent crime rate was 790.7 per 100,000 residents, a significant rise from 575.1 in 2022. Property crimes, encompassing burglary, theft, and motor vehicle theft, are particularly prevalent. For instance, in 2023, the property crime rate stood at 1,349.2 per 100,000 residents, underscoring the city’s challenges in curbing such offenses.
Comparative Analysis with Neighboring Cities
When compared to neighboring cities, Emeryville’s crime statistics are concerning. For example, Berkeley reported a crime index of 543.9, while Oakland’s was slightly higher than Emeryville at 1,507.8. This positions Emeryville among the cities with the highest crime rates in the region, despite its smaller population.
Recent Trends and Community Impact
As of February 2025, the Emeryville Police Department reported a total of 123 Part 1 crimes, a decrease from 138 in January 2025. Violent crimes accounted for 14 incidents, including 5 robberies and 2 aggravated assaults.
Property crimes were more prevalent, with 109 incidents comprising 25 auto burglaries, 23 auto thefts, and 45 petty thefts. Year-to-date comparisons indicate a 44% reduction in robberies and a 17% decrease in aggravated assaults compared to the same period in 2024.
10. Modesto
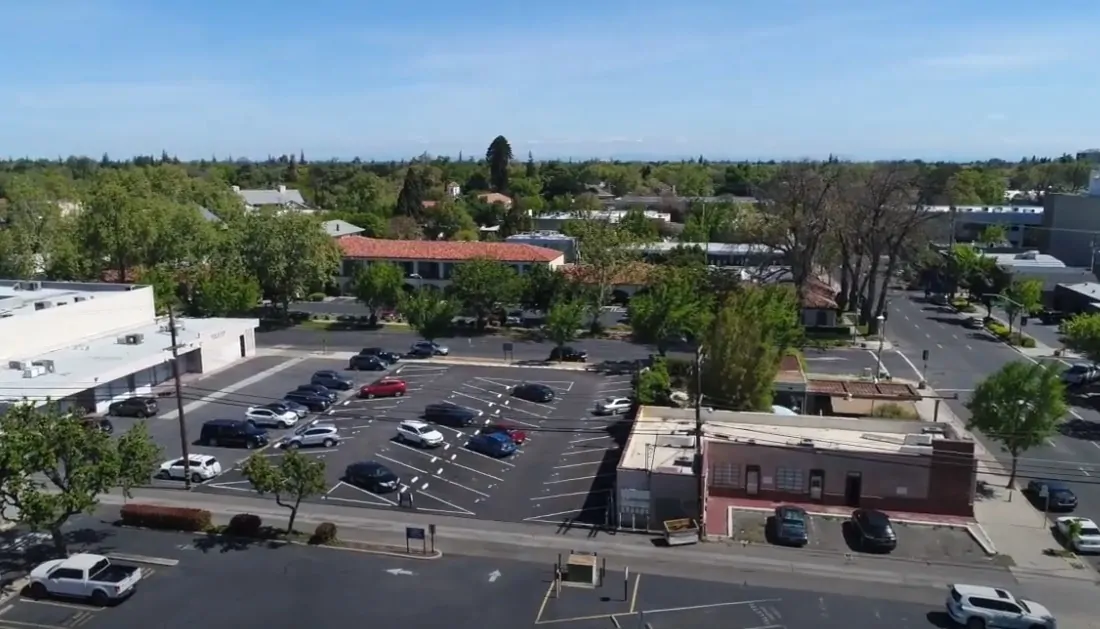
Modesto, another city in the Central Valley, also faces socio-economic difficulties. With a high violent crime rate, safety is on the minds of many who live here.
Modesto’s high poverty rate adds another layer of struggle, affecting families’ access to stable jobs and good schools.
Overall Crime Rate
According to NeighborhoodScout, Modesto’s crime rate stands at 33 per 1,000 residents, placing it among the highest in the nation.
This means residents face a 1 in 30 chance of becoming a victim of either violent or property crime.
Violent Crime Rate
Statistics also show that the city experiences a violent crime rate of 7.66 per 1,000 residents, which is notably higher than the national median of 4 per 1,000.
This includes offenses such as assault, robbery, rape, and murder.
According to Modbee, in 2024, the Modesto Police Department investigated seven homicides, marking the lowest number since 2002, which recorded five. This is a notable decrease from previous years, indicating a positive trend in reducing violent crimes.
Property Crime Rate
Property crimes in Modesto occur at a rate of 25.32 per 1,000 residents, surpassing the national median of 20 per 1,000, as per NeighborhoodScout numbers. This category encompasses burglary, theft, and motor vehicle theft.
Motor Vehicle Theft
Modesto has one of the highest rates of motor vehicle theft in the nation, with a rate of 4.44 per 1,000 residents, statistics show. This translates to a 1 in 225 chance of having a vehicle stolen.
Police Presence
According to City-Data, the city employs 184 police officers, equating to approximately 0.85 officers per 1,000 residents.
This is significantly below the California average of 2.30 officers per 1,000 residents, potentially impacting the city’s ability to effectively manage and reduce crime.
9. Inglewood

Inglewood, part of Los Angeles County, has seen some positive development in recent years. But crime and economic disparities are still very real concerns here.
The violent crime rate is very high, which reflects ongoing safety issues, and economic inequalities continue to affect the quality of life for many.
Violent Crime Rate
According to BestPlaces statistics, Inglewood’s violent crime rate stands at 36.5, surpassing the national average of 22.7.
Property Crime Rate
Statistics provided by BestPlaces also show that the city experiences a property crime rate of 35.6, slightly above the national average of 35.4.
Overall Crime Rate
With a crime rate of 36 per 1,000 residents, Inglewood ranks among the higher crime rates in the U.S., giving residents a 1 in 28 chance of becoming a victim, as per NeighborhoodScout.
Motor Vehicle Theft
Statistics also show that Inglewood faces a notably high rate of motor vehicle theft, with residents having a 1 in 93 chance of their car being stolen.
Year-over-Year Crime Increase
The city has seen a 21% increase in crime year over year, indicating a rising trend in criminal activities, as per AreaVibes.
8. Richmond
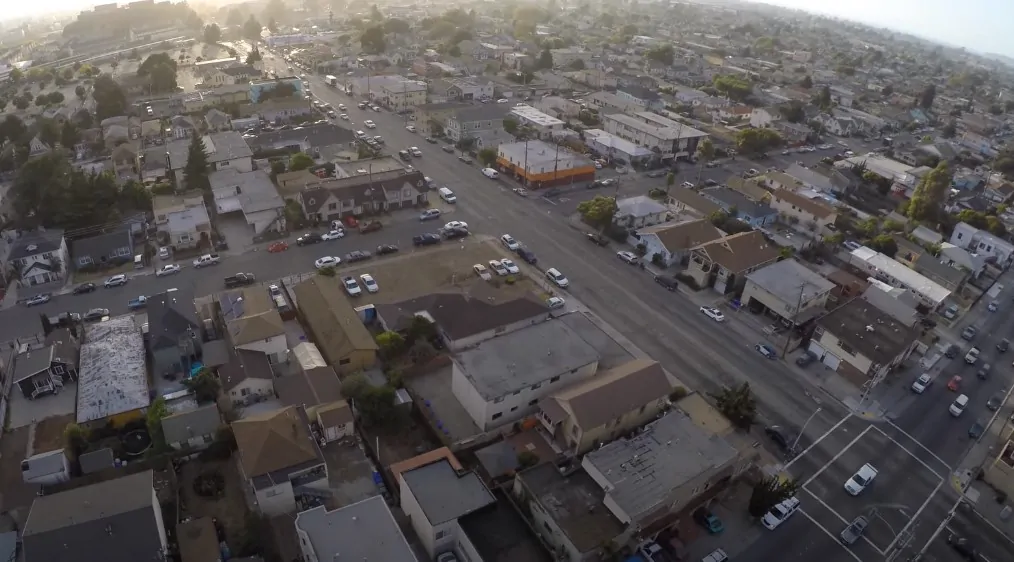
Richmond, located in the East Bay, has long grappled with high crime rates and economic hardship. With a high number of violent incidents, safety is a primary concern for many.
Economic disparities make it tough for families to access resources like quality education and healthcare.
Homicides
As of September 2024, Richmond reported 10 homicides.
Aggravated Assaults
The city recorded 740 aggravated assaults by September 2024.
Motor Vehicle Thefts
There were 909 motor vehicle thefts reported up to September 2024.
Total Index Crimes
By September 2024, Richmond had a total of 3,494 index crimes, encompassing various offenses.
Overall Crime Rate
NeighborhoodScout reports that Richmond’s total crime rate stands at 37 per 1,000 residents, indicating a higher crime rate than 92% of California communities.
Violent Crime Rate
Statistics also show that the violent crime rate is 8.85 per 1,000 residents, significantly above the national median of 4.
Preliminary 2024 Crime Statistics for Richmond, California
The entirety of 2024 statistics are not yet fully audited and may be subject to change. However, preliminary data provides insight into the city’s crime trends over the past year. Here’s what we found out from Contra Costa News:
- Homicides: 11
- Sexual Assaults: 96
- Robberies: 266
- Aggravated Assaults: 914
- Burglaries: 277
- Larceny-Theft: 1,700
- Vehicle Thefts: 1,032
- Arson: 31
7. Compton

Compton’s reputation often precedes it, especially when it comes to crime and gang activity. With a high violent crime rate, safety remains a pressing issue.
But let’s not overlook the progress that’s been made. Compton’s residents have pushed for better education, safer streets, and more opportunities for young people.
Change isn’t easy, but there’s a deep pride in this community and a determination to reshape its future.
Overall Crime Rate
In 2022, Compton reported a total of 3,524 crimes, translating to a crime rate of 38 per 1,000 residents.
This is significantly higher than the national average, placing Compton among the top 100 most dangerous cities in the U.S.
Violent Crime Rate
The violent crime rate in Compton stands at 11.4 per 1,000 residents, meaning residents have a 1 in 88 chance of becoming a victim of violent crime. This rate is more than double the national average.
Property Crime Rate
Property crimes, including burglary, theft, and motor vehicle theft, occur at a rate of 26.91 per 1,000 residents in Compton. This is higher than both the California and national averages.
Motor Vehicle Theft
Compton experiences one of the highest rates of motor vehicle theft in the nation, with a rate of 11.08 per 1,000 residents. This means there’s a 1 in 90 chance of having a vehicle stolen.
Year-Over-Year Crime Increase
According to AreaVibes, between 2021 and 2022, Compton saw a 3.6% increase in overall crime rates. While violent crime decreased by 7.1%, property crime rose by 8.9% during the same period.
6. Stockton

Over in the Central Valley, Stockton tells a story of economic struggle. With violent crime in this city, safety is a major concern.
Being one of the most ghetto and dangerous cities in the whole U.S., you should be very careful and look out for your safety if visiting.
Stockton’s high unemployment rate only adds to the challenge, leaving families with fewer opportunities to build a stable life.
Overall Crime Reduction
The Stockton Police Department reported an 11.6% decrease in overall reported crimes during the first three quarters of 2024 compared to the same period in 2023.
Robbery Incidents
Robberies dropped by 17.6% from January to September 2024, indicating a significant decline in such offenses.
Auto Theft Cases
Auto thefts saw a 14.2% reduction in the first three quarters of 2024, reflecting enhanced vehicle security and law enforcement efforts.
Aggravated Assaults
Aggravated assaults experienced a slight uptick of 0.1% during the same timeframe, suggesting a need for continued focus on violent crime prevention.
Homicide Rate
In 2024, Stockton experienced a 20% increase in homicides, with 54 reported cases compared to 45 in 2023.
5. Vallejo

Vallejo, located in the North Bay, is a city with a rich history, yet its present-day challenges are significant.
Economic instability and crime are daily realities, with violent crime being a constant issue. Poverty is prevalent, limiting economic opportunities for many Vallejo residents.
Overall Crime Rate
NeigbourhoodScout reported that Vallejo’s crime rate stands at 52 per 1,000 residents, placing it among the highest in the nation.
This means there’s a 1 in 19 chance of falling victim to crime here.
Violent Crime Rate
Statistics show that the city experiences a violent crime rate of 9.83 per 1,000 residents, which is nearly double the national median of 4. This includes offenses like murder, rape, robbery, and assault. Here’s what the NY Post reported:
- Homicides: Vallejo experienced 23 homicides between January and November 2024.
- Shootings: There were 200 shooting incidents in 2024.
- Rapes: There were 44 reported rapes in 2024, marking a 26% increase from the previous year.
- Aggravated Assaults: The city recorded 503 aggravated assaults in 2024.
- Domestic Violence Cases: The city handled 352 domestic violence cases during the year.
Property Crime Rate
NeighborhoodScout numbers show that property crimes are notably high, with a rate of 42.65 per 1,000 residents. This encompasses burglary, theft, and motor vehicle theft.
Motor Vehicle Theft
Statistics show that Vallejo has one of the highest rates of motor vehicle theft in the nation, with a 1 in 107 chance of your car being stolen.
- Auto Burglaries/Thefts: A total of 1,101 auto burglary and theft incidents were reported.
Year-over-Year Crime Increase
According to AreaVibes, over the past year, Vallejo has seen a 20% increase in overall crime, which is a growing concern for residents and authorities alike.
4. San Bernardino

San Bernardino, nestled in the Inland Empire, faces its own share of obstacles. Economic instability has taken a toll on this city, where the violent crime rate is spiking.
Even as local leaders work toward solutions, issues like unemployment and limited access to affordable housing make it hard for families to thrive.
Overall Crime Rate
San Bernardino’s crime rate stands at 44 incidents per 1,000 residents, placing it among the highest in the nation. This means residents face a 1 in 23 chance of falling victim to either violent or property crimes.
Violent Crime Rate
The city experiences a violent crime rate of 12.62 per 1,000 residents, significantly surpassing the national median of 4. This includes offenses such as murder, rape, robbery, and assault.
Property Crime Rate
Property crimes occur at a rate of 31.17 per 1,000 residents in San Bernardino, compared to the national median of 20. This category encompasses burglary, theft, and motor vehicle theft.
Murder Rate
In 2022 alone, San Bernardino reported 72 murders, equating to a rate of 32.3 per 100,000 people. This figure is notably higher than the national average of 6.3 per 100,000.
Motor Vehicle Theft Rate
The city faces a motor vehicle theft rate of 7.99 per 1,000 residents, which is among the highest in the nation. Residents have a 1 in 125 chance of having their vehicle stolen.
San Bernardino has one of the highest vehicle theft rates in California.
3. Fresno

Fresno is one of California’s largest cities, and it’s also one that faces some of the toughest issues. Crime, poverty, and gang violence all impact daily life here.
Economic inequality and limited access to education mean that opportunities are often scarce for Fresno’s residents.
Near Fresno there are numerous prisons, some of which are definitely places you want to avoid.
Homicide Rate & Violent Crime In 2024
According to Gvwire, the city reported 30 homicides, a decrease from 35 in 2023, continuing a downward trend from 74 homicides in both 2020 and 2021.
Shootings also saw a significant reduction, with 221 incidents in 2024 compared to 359 in 2023.
Additionally, the number of gunshot wound victims decreased to 107 in 2024, down from 143 the previous year.
Agravated assaults totaled 2,817, a slight decrease from 2,890 in 2023.
The city also observed a 16.6% reduction in rapes and a 1.6% decrease in robberies.
Overall Crime Rate
According to NeighborhoodScout, Fresno’s crime rate stands at 44 per 1,000 residents, placing it among the highest in the nation. Residents face a 1 in 23 chance of becoming a victim of either violent or property crime.
Property Crime Rate
NeighborhoodScout statistics also show that property crimes occur at a rate of 35.54 per 1,000 residents in Fresno, surpassing the national median of 23.43.
Vehicle Theft Incidents
Fresno reported 3,134 motor vehicle thefts, equating to a rate of 573.1 per 100,000 residents, significantly higher than the national average of 282.7, as per AreaVibes.
2. Bakersfield – Concerning Violent Crime
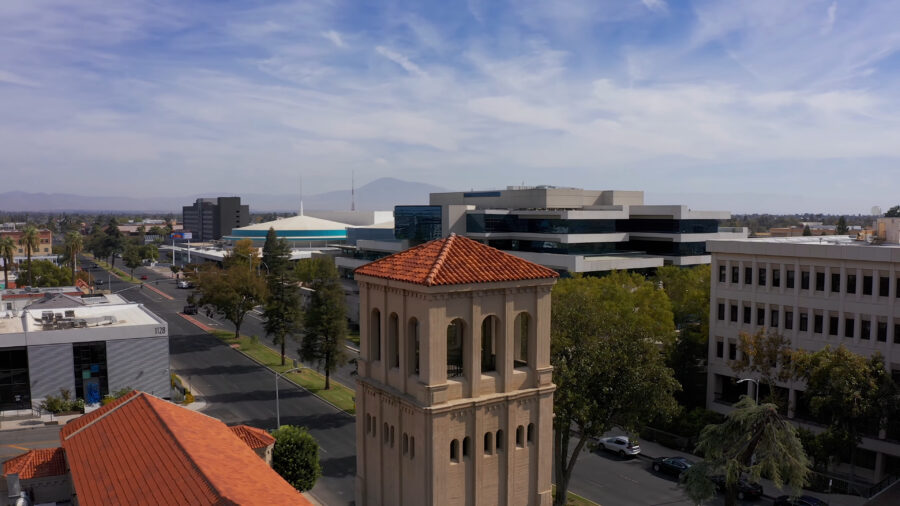
Bakersfield may be known for its agricultural roots, but it’s also a city where poverty and crime affect daily life.
Limited social services make it harder for residents to overcome economic struggles and access essential resources.
Overall Crime Rate
According to AreaVibes, Bakersfield’s crime rate stands at 4,519 incidents per 100,000 residents, nearly double the national average.
Violent Crime Rate
As per statistics, the city experiences 546 violent crimes per 100,000 people, which is 47.7% higher than the national average.
Property Crime Rate
Statistics also show that property crimes occur at a rate of 3,972 per 100,000 residents, surpassing the national average by 103.3%.
Motor Vehicle Theft
According to AreaVibes, with 1,179 vehicle thefts per 100,000 people, Bakersfield ranks among the highest in the nation.
Homicide Rate
CalMatters reported that in 2020 alone, Kern County, where Bakersfield is located, had a homicide rate of 12.7 per 100,000 residents, the highest in California.
1. Oakland – The Most Dangerous City In California

Oakland is one of California’s most complex cities and one of the cities with the most murders in America as of 2024. Some areas of the city are still plagued by significant challenges. Violent crime rates are high, with around 1,521 incidents per 100,000 residents – well above the national average.
Poverty here doesn’t just affect individuals; it impacts entire communities. In some neighborhoods, people have limited access to quality jobs and schools.
It’s an uphill battle to tackle these issues, but Oakland’s resilient spirit means that hope is never far away.
Overall Crime Reduction
Preliminary reports indicate that Oakland experienced a 34% decrease in its overall crime rate in 2024 compared to the previous year, as per KTVU.
Decrease in Homicides
As of October 2024, there were 71 homicides in Oakland, marking a decrease from previous years, Oaklandside reports.
Decline in Assaults
KRON4 reports that assaults involving firearms have dropped by 21% this year, indicating a positive trend in reducing violent encounters.
However, despite the overall decline in assaults, robberies have increased by 11%, with residential robberies spiking by 118%.
Property Crime Trends
As per the New York Post, burglaries have decreased by 50%, yet car thefts remain a concern, with over 3,500 incidents reported in 2024 alone.
Early 2025 Crime Data
Detailed statistics for January and February 2025 are not yet available. However, it’s noteworthy that the end of 2024 and the beginning of 2025 were marked by a surge in violence, with five homicides occurring between December 31, 2024, and January 1, 2025, as per KTVU reports.
Key Challenges Across These Cities
Across these 10 cities, common themes emerge:
- High Crime Rates: Safety remains a top concern, affecting everything from community trust to local business growth.
- Economic Instability: Unemployment and poverty are widespread, making it difficult for families to access basic needs.
- Limited Access to Quality Education: Many of these areas struggle with underfunded schools and limited educational resources.
These issues don’t exist in isolation. When combined, they create an environment where people are forced to work much harder to access opportunities that may be readily available elsewhere in California.
Methodology
- I reviewed 2023-2024 stats on crime rates, unemployment, and poverty from official sources.
- I looked at local reports and community initiatives to understand ongoing challenges.
- Cities were ranked based on combined economic hardship, crime rate, and community impact.
Last Words
After looking at some of the most dangerous cities in California, it’s clear that safety varies quite a bit across the state. While some areas face higher crime rates, it’s important to remember that every city is made up of more than just statistics.
People live, work, and raise families in these places. Crime can be a challenge, but there are also efforts underway to improve safety and strengthen communities. By staying informed and aware, we can all take steps to protect ourselves and contribute to making neighborhoods safer for everyone.
References
- neighborhoodscout.com – California Crime Rates and Statistics
- city-data.com – Crime in California (CA)
- bestplaces.net – California Crime
- areavibes.com – Top 10 Most Dangerous Cities in California (2024)
- ci.richmond.ca.us – City of Richmond 2024 Crime Statistics
- stocktonia.org – Stockton crime down in 2024, police data shows
- yourcentralvalley.com – Fresno sees 300% homicides increase in comparison with 2023
- calmatters.org – ‘Devil on the loose’: What’s behind Kern County’s soaring homicide rate?
- nbcbayarea.com – Crime numbers down in Oakland, police data shows
- oaklandside.org – Homicides are finally and significantly falling in Oakland
- kron4.com – Here’s what latest data says about Oakland’s crime rates
- nypost.com – Elderly Oakland man’s prized antique Corvette stolen from his home in broad daylight: ‘No consequences in this city’
Related Posts:
- The List of Free Speech Supreme Court Cases in The…
- What Is the Current Inflation Rate in the U.S.? -…
- Most Dangerous Cities in Ohio - Top 10 Risky Areas…
- Most Dangerous Cities in Mexico 2025 - Top 10 Places…
- Top 5 Most Dangerous Neighborhoods in the Bronx for 2025
- California Daylighting Law - Is It Really Effective…


