

Black unemployment rose sharply in September 2026, climbing from 6.0% in August to 7.0%, according to the latest Bureau of Labor Statistics data.
The increase was much larger than the movement in the overall US unemployment rate, which came in at 4.2%. The national rate was 4.1% in August and 4.2% in June, so the September reading remained close to the level seen through much of the summer.
About 1.55 million Black Americans were unemployed in September, up from 1.32 million one month earlier. At the same time, both Black employment and labor force participation increased, which makes the monthly change more useful to examine than the 7% headline alone.
Methodology
We based this analysis on seasonally adjusted data from the Bureau of Labor Statistics Current Population Survey. The CPS is the federal household survey used to calculate the official US unemployment rate and demographic unemployment figures.
- September unemployment data came from the BLS race and employment table, which reports employment, unemployment and labor force participation by race.
- For the national comparison, we used the seasonally adjusted unemployment rate for people age 16 and older from the September Employment Situation report.
- For the monthly trend, we compared May through September 2026 rather than treating the September increase as an isolated number.
- For the year-over-year comparison, September 2026 was compared with September 2025 using the same seasonally adjusted BLS series.
- Black or African American follows the CPS race classification. BLS notes that Hispanic or Latino ethnicity is measured separately and people of Hispanic or Latino ethnicity can also be included in a racial group.
- The CPS surveys about 60,000 households each month. Monthly estimates for smaller demographic groups have more sampling uncertainty than the national unemployment rate, so one-month changes should be read alongside several months of data.
- For earlier context, we also reviewed our July 2026 jobs report, when Black unemployment stood at 6.3%.
- We used bar chart maker to present certain statistics and make them easier to understand.
Black Unemployment Jumped One Full Percentage Point in September
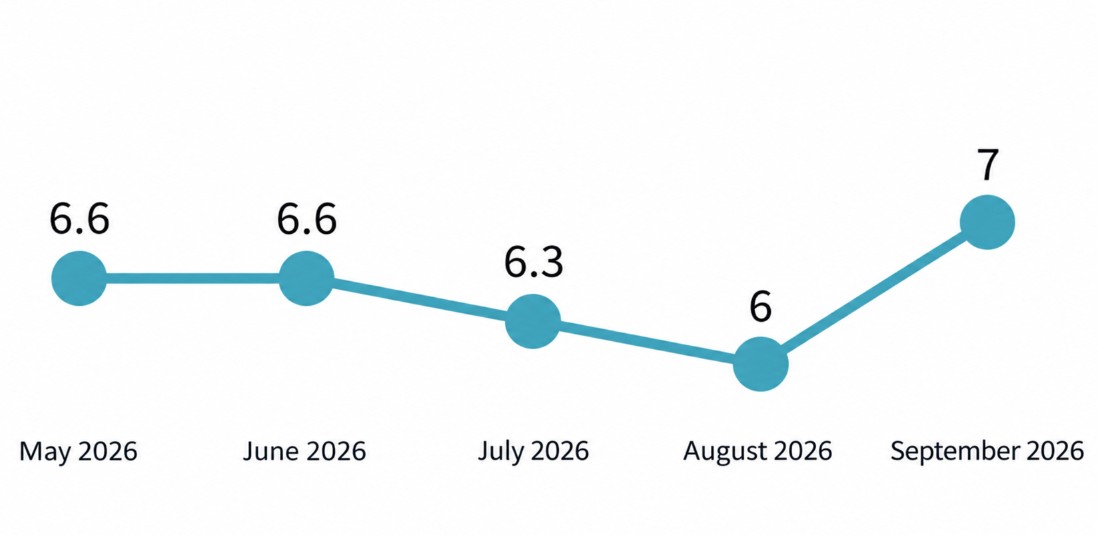
The clearest change in the September demographic data was the rise in Black unemployment from 6.0% to 7.0% in one month.
That is an increase of 1.0 percentage point. Expressed relative to the August rate, unemployment was about 16.7% higher.+
| Month | Black Unemployment Rate | National Unemployment Rate |
| May 2026 | 6.6% | 4.3% |
| June 2026 | 6.6% | 4.2% |
| July 2026 | 6.3% | 4.1% |
| August 2026 | 6.0% | 4.1% |
| September 2026 | 7.0% | 4.2% |
The direction before September had been favorable. Black unemployment fell from 6.6% in May and June to 6.3% in July and then 6.0% in August.
September erased all of that decline and pushed the rate above every monthly reading shown in the table.
About 231,000 More Black Workers Were Counted as Unemployed
The unemployment rate increased because the number of unemployed Black workers rose considerably during the month.
BLS counted about 1.552 million unemployed Black Americans in September, compared with 1.321 million in August. That is an increase of roughly 231,000 people.
| Black Labor Force Measure | August 2026 | September 2026 | Change |
| Civilian labor force | 21.872 million | 22.212 million | +340,000 |
| Employed | 20.550 million | 20.660 million | +110,000 |
| Unemployed | 1.321 million | 1.552 million | +231,000 |
| Labor force participation | 61.6% | 62.5% | +0.9 points |
| Employment-population ratio | 57.8% | 58.1% | +0.3 points |
The table helps explain why the September increase cannot be reduced to a simple story of 231,000 people losing jobs.
View this post on Instagram
Black employment actually increased by about 110,000 during the month. The labor force expanded by about 340,000, meaning many more people were working or actively looking for work.
The number entering the labor force was larger than the increase in employment. As a result, the count of people classified as unemployed rose sharply.
Black Labor Force Participation Rose to 62.5%
The Black labor force participation rate increased from 61.6% in August to 62.5% in September.
That 0.9 percentage point increase is substantial for a monthly CPS estimate. It also put Black participation above the national rate of 61.8% for September.
The employment-population ratio moved from 57.8% to 58.1%. More Black Americans were employed as a share of the population than one month earlier, even though the unemployment rate increased at the same time.
Those figures are possible together because unemployment measures people who are in the labor force but do not currently have a job. A person who begins actively looking for work moves into the labor force and is counted as unemployed until a job is found.
The Black-White Unemployment Gap Widened to 3.4 Points
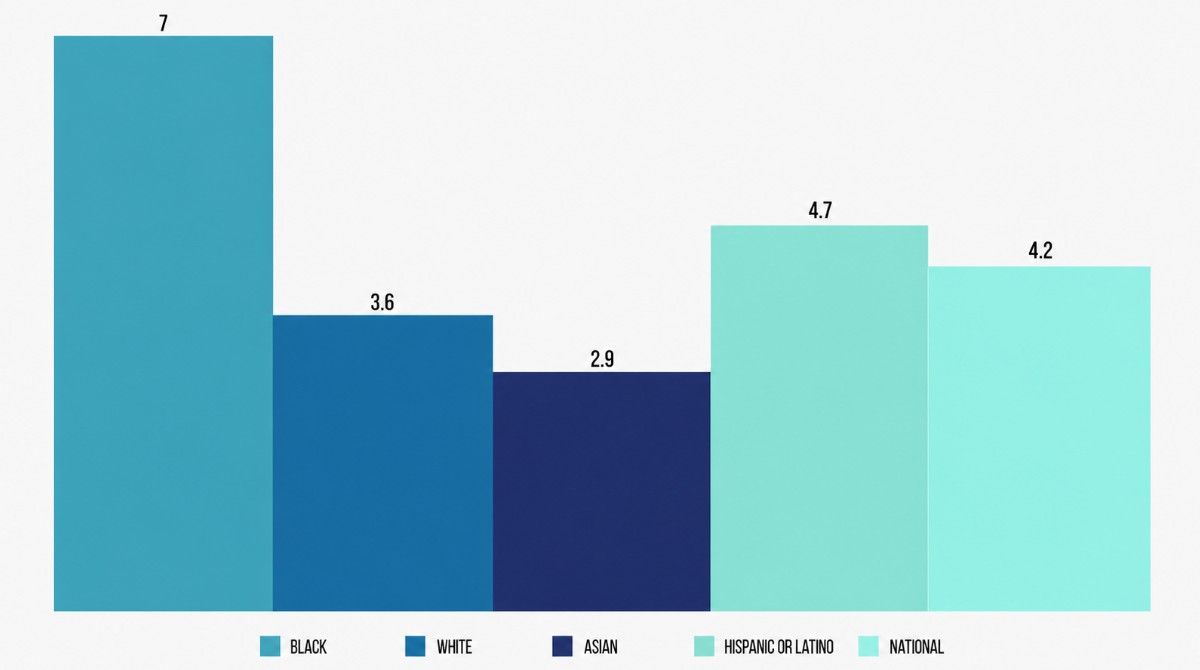
September also widened the gap between Black and White unemployment rates.
White unemployment declined slightly from 3.7% in August to 3.6% in September. Black unemployment moved in the opposite direction, rising from 6.0% to 7.0%.
| Group | August 2026 | September 2026 | Monthly Change |
| Black | 6.0% | 7.0% | +1.0 point |
| White | 3.7% | 3.6% | -0.1 point |
| Asian | 3.2% | 2.9% | -0.3 points |
| Hispanic or Latino | 4.8% | 4.7% | -0.1 point |
| National | 4.1% | 4.2% | +0.1 point |
The Black unemployment rate was therefore 3.4 percentage points above the White rate in September. The gap had been 2.3 points in August.
Compared with the overall national rate, Black unemployment was 2.8 points higher in September. In August, the gap was 1.9 points.
BLS explains in its race and ethnicity data guide that Hispanic ethnicity is a separate CPS classification from race. Hispanic workers can therefore also be included within White, Black or Asian racial categories, so the groups in the table should not be added together.
Black Women Saw A Larger Increase Than Black Men
The September increase was not evenly distributed across age and sex groups.
Among Black men age 20 and older, unemployment increased from 5.6% in August to 6.0% in September.
Among Black women age 20 and older, the rate rose from 5.6% to 6.8%. The 1.2 point increase was three times the change recorded for Black men.
| Black Workers | August 2026 | September 2026 | Change |
| Men age 20+ | 5.6% | 6.0% | +0.4 points |
| Women age 20+ | 5.6% | 6.8% | +1.2 points |
| Age 16 to 19 | 17.5% | 19.9% | +2.4 points |
Black teenagers had the highest unemployment rate of the groups reported in the BLS race table. Their rate increased from 17.5% to 19.9%.
Teen estimates can move considerably from month to month because the underlying survey population is much smaller. The direction is still worth recording, but a single monthly figure should not carry the same weight as a longer series.
Black Women Added Workers to the Labor Force Even as Unemployment Increased
The data for Black women provides another example of why the unemployment rate needs context.
The Black female labor force increased from about 10.874 million in August to 11.116 million in September. Employment also increased from 10.264 million to 10.359 million.
At the same time, the number of unemployed Black women rose from about 610,000 to 757,000.
The participation rate increased from 60.6% to 61.9%, while the employment-population ratio moved from 57.2% to 57.7%.
More Black women were therefore employed in September than in August, but an even larger number entered or returned to the labor force without immediately finding work.
Black Men Had A Smaller Monthly Increase
The labor market moved differently for Black men age 20 and older.
Employment declined from about 9.631 million in August to 9.563 million in September. The number unemployed increased from 572,000 to 612,000.
Labor force participation slipped from 68.3% to 68.1%, and the employment-population ratio fell from 64.5% to 64.0%.
Unlike the figures for Black women, the rise in unemployment among Black men came alongside lower employment and slightly lower labor force participation.
September Reversed Three Months of Improvement
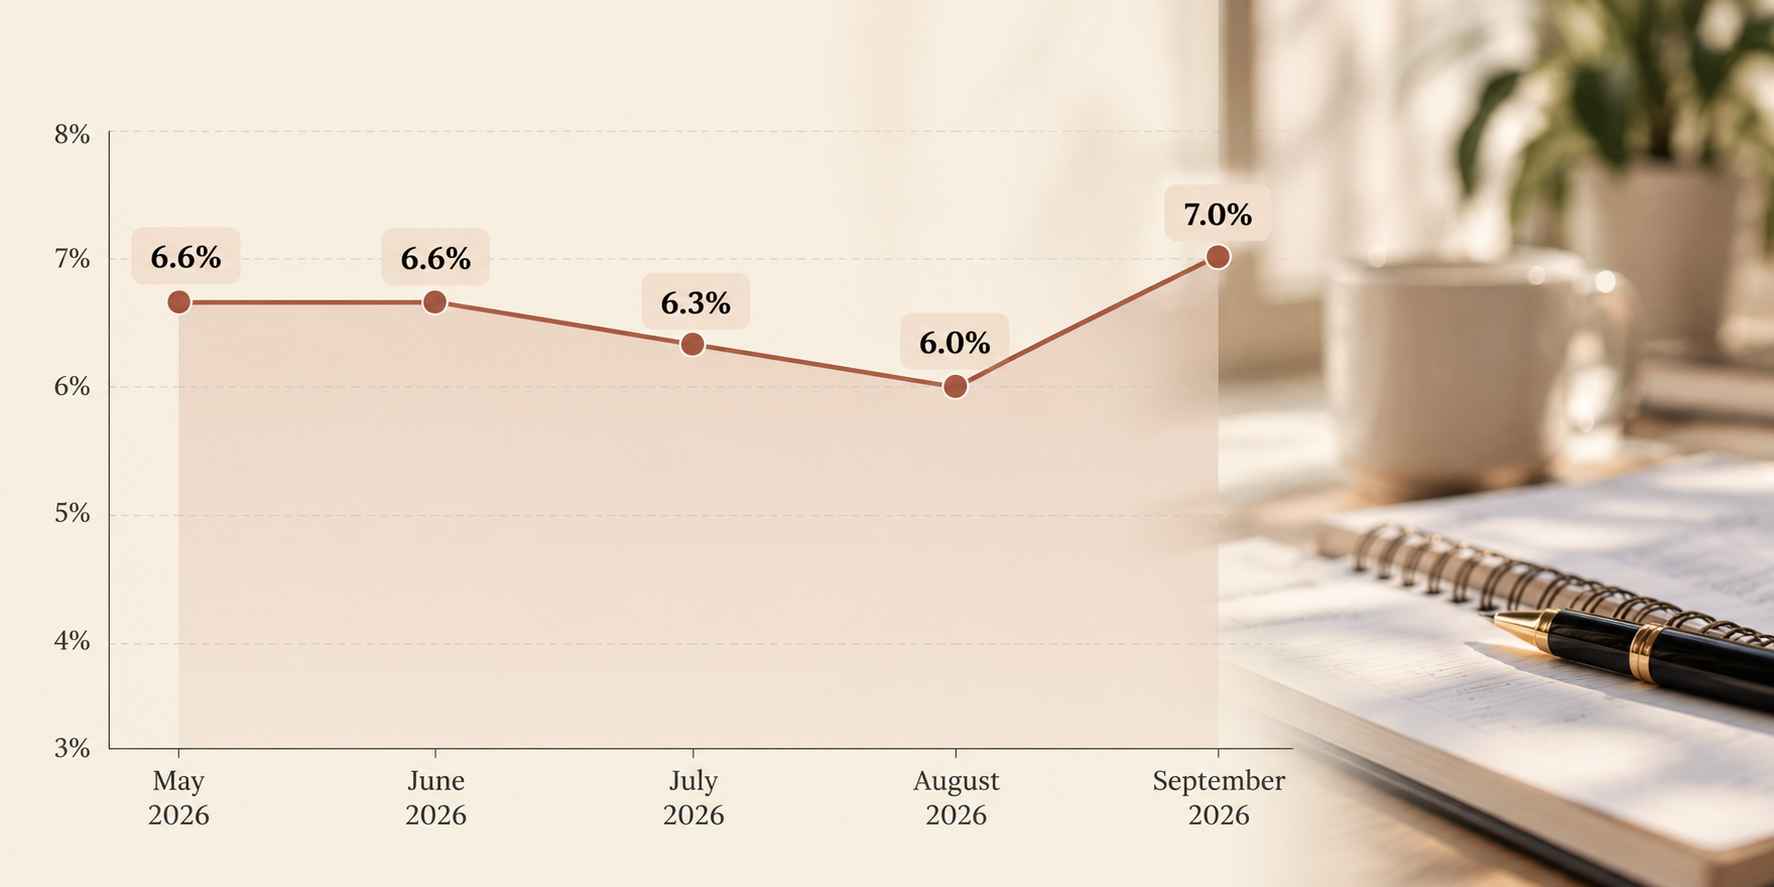
The monthly sequence provides one of the clearest ways to read the latest data.
Black unemployment remained at 6.6% in May and June, declined to 6.3% in July and reached 6.0% in August. September then pushed the rate to 7.0%.
| Period | Black Unemployment | Change From Previous Month |
| May 2026 | 6.6% | Not shown |
| June 2026 | 6.6% | 0.0 points |
| July 2026 | 6.3% | -0.3 points |
| August 2026 | 6.0% | -0.3 points |
| September 2026 | 7.0% | +1.0 point |
The September increase is larger than the combined 0.6 point decline recorded during July and August.
One month does not establish a lasting reversal, however. The BLS guidance on CPS uncertainty explains that household survey estimates are based on a sample and can move because of sampling as well as actual labor market changes.
The Black Unemployment Rate Was 67% Higher Than The National Rate
A 7.0% Black unemployment rate compared with a 4.2% national rate means the Black rate was about 67% higher in September.
The calculation should not be confused with the 2.8 percentage point gap between the two rates. Percentage points measure the direct difference, while the 67% figure compares one rate with the other.
| September 2026 Comparison | Rate |
| Black unemployment | 7.0% |
| National unemployment | 4.2% |
| Percentage point gap | 2.8 points |
| Black rate above national rate | About 67% |
That gap also widened sharply from August, when Black unemployment was 6.0% and national unemployment was 4.1%.
Last Words
Black unemployment rose sharply, from 6.0% to 7.0%, and the number of unemployed Black Americans increased by about 231,000. The rise was much larger than the change in the national unemployment rate.
Black employment also increased by about 110,000 and labor force participation climbed 0.9 percentage points. A large inflow into the labor force therefore contributed to the higher unemployment rate.
The September result also breaks with the movement recorded earlier in the summer. Black unemployment had declined in both July and August before rising a full percentage point in September.
The next few monthly reports will provide more evidence on whether September was a short-term jump or the beginning of a weaker period for Black workers. The longer comparison remains less severe than the monthly headline, with the 7.0% rate still below the 7.6% recorded in September 2025.