Skip to content

Crime statistics can feel abstract until they land close to home. Delaware’s 2025 picture sits at an intersection of two realities. One is a clear, documented statewide improvement over several years.
The other is a city-level snapshot in 2025 that shows movement happening week by week, sometimes quietly, sometimes sharply.
Putting those layers together gives a grounded way to talk about crime without exaggeration or complacency.
Today, we are going to take a look at Delaware’s most recent official statewide and county trend framework with the clearest 2025 city data the state publishes on a regular basis. Let’s get started.
Key Points
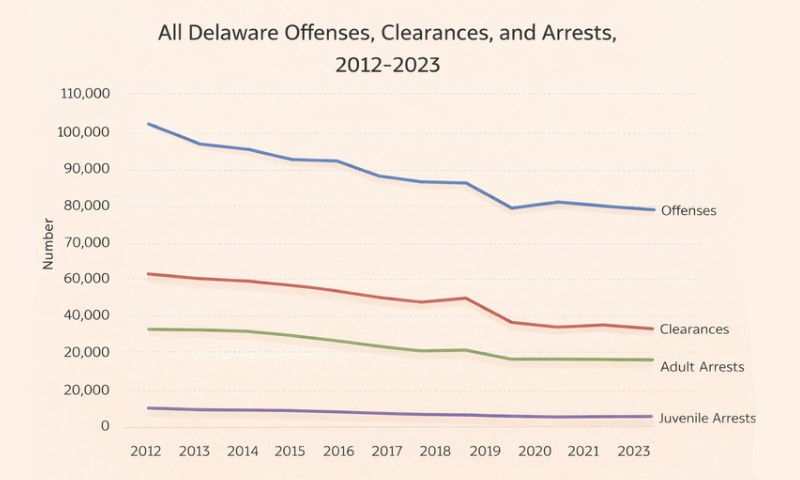
- Statewide serious crime in Delaware declined meaningfully through 2023, with both total offenses and per-capita rates moving down, forming the baseline for 2025 discussions.
- New Castle County remains the primary driver of statewide crime trends, making Wilmington’s city-level data especially influential for understanding current movement.
- Wilmington’s 2025 year-to-date data shows lower murders, shootings, felony theft, and auto theft compared to 2024, while robbery and aggravated assault remain largely flat.
- Burglary and everyday property crime pressures persist, indicating that improvements are uneven and concentrated by offense type rather than universal.
How Crime Is Counted in Delaware and Why It Matters

Before looking at rates or rankings, it helps to know how Delaware defines crime in its official reporting.
Statewide Reports Rely on NIBRS Group A Offenses
Delaware’s statewide “Crime in Delaware” series is produced by the Statistical Analysis Center and is built on the FBI’s National Incident-Based Reporting System. In practical terms, the reports track serious crimes known to law enforcement, categorized as NIBRS Group A offenses.
Examples include murder, rape, robbery, aggravated assault, burglary, theft, and motor vehicle theft. Lesser Group B offenses are generally excluded from the headline totals.
That approach creates consistency across counties and years, which is why the statewide and county trend data are reliable for long-run comparisons.
City CompStat Data Uses Local Categories and Moves Faster
At the city level, particularly in Wilmington , police departments publish CompStat reports that update weekly.
Wilmington’s reports show year-to-date totals and percent changes for major crime categories, plus shooting incidents and victims.
Those numbers are preliminary by design and follow Delaware criminal code categories rather than FBI summaries. As a result, CompStat and statewide reports can differ slightly in definitions and totals. The tradeoff is speed. CompStat shows where things are heading in real time.
The NIBRS Transition Affects Comparisons
Delaware, like other states, transitioned from the older Summary Reporting System to NIBRS in 2021.
Police departments such as Newark publicly explain that their major crime graphs now reflect NIBRS definitions, with the FBI Crime Data Explorer used for deeper comparisons.
The practical takeaway is simple: comparisons are strongest when made within the same system and time frame.
Delaware Statewide Crime Trends: 2019 to 2023
The most recent official statewide report series runs from 2019 through 2023. Even though it does not extend into 2025, it provides the baseline that shapes current policy and enforcement decisions.
Note: All figures come from the Statistical Analysis Center’s 2019 to 2023 executive brief.
Serious Crime Declined in Both Volume and Rate
According to Delaware’s Statistical Analysis Center, total serious criminal offenses known to police decreased 10%, falling from 75,348 in 2019 to 67,573 in 2023.
Over the same period, the statewide crime rate dropped from 76.7 offenses per 1,000 persons to 65.6.
The rate matters as much as the count. Delaware’s population shifted during that period, especially with growth in Sussex County.
A decline in both count and rate indicates a genuine reduction rather than a demographic illusion.
Violent Crime Showed Stability With Late Upward Pressure
Delaware’s Statistical Analysis Center also pointed out that statewide violent offenses decreased 2% from 2019 to 2023. Compared to 2022 alone, violent offenses increased 4%.
That pattern suggests a longer arc of mild improvement paired with short-term pressure toward the end of the series.
For residents, that combination often feels confusing. Fewer incidents overall can coexist with periods that feel tense on the ground, especially when violence clusters in specific neighborhoods or time windows.
County-Level Crime Patterns Across Delaware
Crime in Delaware is not evenly distributed. County-level data from the statewide reports shows where volume is concentrated and how trends differ.
County Shares and Trend Direction
| County | Share of statewide offenses | Total offense trend (2019 to 2023) | What it suggests |
| New Castle County | 54% (2022) | -11% | Largest volume, changes here shape statewide outcomes |
| Kent County | 22% | -3% | Near-flat trend, small shifts matter |
| Sussex County | 24% | -14% | Stronger decline, complicated by rapid population growth |
Homicide Context Inside New Castle County
New Castle County reported 28 homicides in 2023, broken down as 24 murder or non-negligent manslaughter cases and 4 vehicular homicides.
Because Wilmington sits inside New Castle County, shifts inside the city often signal where county totals may land in future statewide summaries.
Wilmington as the Lens for 2025 Crime Movement

Wilmington offers the clearest publicly available window into Delaware’s 2025 crime patterns. The city publishes weekly CompStat reports with year-to-date totals and year-over-year comparisons.
What Wilmington CompStat Is Designed to Show
Wilmington’s CompStat system is built for near-real-time tracking. Its purpose is practical rather than archival: identify emerging trends, adjust deployments, and measure outcomes week by week. Public reporting dates back to the city’s 2017 CompStat implementation.
Wilmington Citywide Crime Totals for 2025 Year-To-Date
As of the week ending 12/14/25, Wilmington’s CompStat report compares 2025 year-to-date totals with the same period in 2024.
| Category | 2025 YTD | 2024 YTD | Percent change |
| Murder | 18 | 24 | -25% |
| Rape | 1 | 3 | -67% |
| Robbery | 174 | 176 | -1% |
| Aggravated assault | 358 | 365 | -2% |
| Burglary | 338 | 332 | +2% |
| Felony theft | 231 | 278 | -17% |
| Auto theft | 391 | 449 | -13% |
| Total listed Part I-style categories | 1511 | 1627 | -7% |
| Shooting incidents | 63 | 76 | -17% |
| Shooting victims | 83 | 95 | -13% |
Source: Wilmington Police Department CompStat report for the week of 12/08/25 through 12/14/25.
Interpreting Wilmington’s 2025 Pattern
Several points stand out:
- Murders and shooting indicators are lower than in 2024, with murders down 25% and shooting incidents down 17%.
- Robbery and aggravated assault are close to flat, changing by 1% to 2%.
- Property crime shows mixed movement, with burglary slightly higher while felony theft and auto theft declined by double digits.
Why 2024 Still Shapes the 2025 Conversation
Crime trends do not reset on January 1. What happened in 2024 provides context for interpreting changes seen in 2025.
Key Findings From Wilmington’s 2024 Year-End Review
Comparing calendar years 2023 and 2024, Wilmington reported:
- Homicides decreased by 2.
- Rapes increased by 21%.
- Robbery decreased by 31%.
- Aggravated assaults increased by 25%.
- Violent crime increased by 13 incidents, driven largely by domestic relationships.
- Burglary decreased by 118 incidents.
- Larceny increased by 158 incidents.
- Motor vehicle theft increased by 50 incidents.
- Total Part I crime increased by 101 incidents.
All figures come from Wilmington’s internal year-end review summarized publicly.
Two Mechanisms That Carried Into 2025
The shifts visible in 2025 did not appear out of thin air. Two patterns that shaped crime in 2024 continued to influence how offenses showed up, and declined, across the following year.
Firearm-Related Violence Trendline
Wilmington Police Department reported that violent crime involving firearms was down 37% since 2019, down 45% since 2020, and down 7% since 2023. A dedicated gun crimes unit became operational in 2021, which likely influenced those long-run results.
Theft Mechanics Tied to Behavior
The 2024 review noted that larceny increases were driven by thefts from vehicles, with over 90% of those vehicles unsecured.
Retail theft pressure connected to self-checkout systems was also highlighted. Those behavioral drivers do not vanish overnight, even when totals dip in a given year.
Wilmington in Longer Context: 2019 to 2023

The Statistical Analysis Center publishes a Wilmington-focused supplement covering 2019 through 2023, which helps distinguish short-term fluctuations from structural change.
Key Long-Run Findings for Wilmington
From 2019 to 2023:
- Total offenses were down 14.0% over the five-year period.
- Offenses increased 7.5% from 2022 to 2023.
- Criminal homicides in 2023 were the lowest of the period and down from a record 40 in 2021.
- Forcible sex offenses in 2023 were 50% lower than in 2019.
- Assault offenses decreased 27.1% compared to 2019.
- Robbery offenses decreased 14.7% compared to 2019.
Those figures frame 2025 as part of a longer trajectory rather than an isolated moment.
City and County Crime in 2025 – What Can Be Said with Confidence
A headline promising “latest trends by city and county” needs to be precise about what data actually exists.
What Is Well-Documented
- Wilmington publishes weekly 2025 year-to-date crime totals with raw counts and percent changes.
- Delaware’s statewide and county trend baseline runs through 2023, offering consistent comparisons for New Castle, Kent, and Sussex counties.
What Is Not Yet Consolidated
An official statewide county-by-county report covering 2024 or 2025 has not been released in the same series as the 2019 to 2023 reports.
While detailed jurisdiction-level data exists through Delaware’s open data systems and the FBI Crime Data Explorer, those sources require careful aggregation and definition choices.
Without that work, any clean 2025 county ranking risks overstating certainty.
A Practical Way to Talk About Delaware Crime Trends

A two-tier approach keeps the picture honest.
Tier One: Statewide and County Context
Use the 2019 to 2023 series to show long-run movement, county concentration, and rate changes.
Tier Two: Local 2025 Signals
Use Wilmington’s CompStat data to describe what is changing right now inside the state’s largest city, where weekly reporting allows real-time insight.
That structure reflects how Delaware itself publishes crime information and avoids mixing incompatible datasets.
Takeaways for Residents and Policymakers
- Delaware’s official statewide data shows a sustained decline in serious crime and a lower statewide rate through 2023.
- New Castle County remains the center of crime volume, which makes Wilmington’s trends especially influential.
- Wilmington’s 2025 year-to-date data shows reductions in murders, shootings, felony theft, and auto theft compared to 2024.
- Burglary remains slightly elevated, and robbery and aggravated assault remain largely unchanged.
- Domestic-related violence and unsecured property continue to matter as drivers beneath the totals.
Looking Ahead to 2026
As Delaware moves toward the next statewide reporting cycle, the picture entering 2026 looks more nuanced than alarming. Long-run indicators point downward, while city-level data shows targeted improvements alongside stubborn everyday challenges.
A full county-by-county crime rate ranking for 2025 will require careful aggregation once official summaries catch up.
Until then, the most accurate view blends the stability of statewide reports with the immediacy of city CompStat data. That combination offers clarity without oversimplification, which is exactly what crime statistics should aim to provide.