Skip to content

Let’s talk about Boston in 2026 – specifically, its crime rate. No sugar-coating here; crime stats don’t exactly paint a rosy picture. The numbers show more than just petty offenses. We’re seeing everything from increased carjackings to more brazen acts in neighborhoods once considered safe.
It’s a mix of challenges, with trends that can’t just be brushed off as random spikes. Let’s get into details.
Crime Stats
In 2023, Boston earned the title of the nation’s second-safest city, right behind Dallas. This accolade came from a CBS News report which in turn, cited a Gallup survey.
But, you know, the concept of safety can be pretty subjective. It might depend on which part of Boston you’re in, whether you’re thinking about violent crimes or maybe property crimes, or even your own experiences and feelings of security in the city.
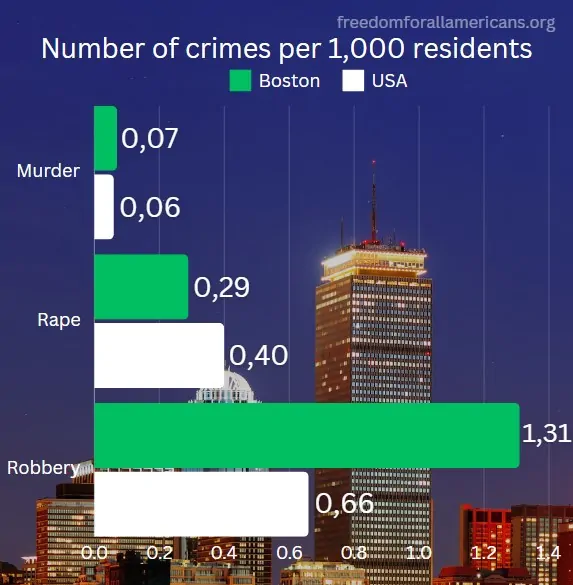
Looking into the specifics for Boston, as we move through 2024, the city’s crime rate stands at 6.6 incidents per 1,000 residents, according to NeighborhoodScout statistics.
That translates to 4,293 violent crimes, a figure that’s over twice the state average for Massachusetts. On the property crime front, there were 14,489 incidents reported in 2023, as the Open data network shows.
Despite these numbers, there’s a silver lining. Boston’s murder rate is lowest in 2023, with 37 homicides, as per Boston.com. When you compare that to the five-year average of 49 homicides, it’s a notable improvement.
The District Attorney’s office has been busy, too, with 24 arrests, 19 pleas, and 12 convictions related to these cases. This drop in homicides came alongside a decrease in both fatal and non-fatal shootings — from 32 to 26 for fatal shootings and from 148 to 118 for non-fatal shootings, according to this report from Boston Police.
Crime Trends
Boston’s crime rate is higher than the national average across all communities in America, with 25 crimes per one thousand residents. However, Boston’s rate is lower than most communities of similar population sizes across America. This suggests that while Boston faces challenges, the city is relatively safe compared to other cities of its size.
Boston, unfortunately, ranks among the cities with the highest murder rates in the U.S., which further underscores the seriousness of its violent crime issues.
Violent crimes in Boston are a significant concern, with a rate that is one of the highest in the nation across communities of all sizes. Violent offenses tracked included rape, murder, non-negligent manslaughter, armed robbery, and aggravated assault, including assault with a deadly weapon. According to the available data, the chance of becoming a victim of one of these crimes in Boston is one in 166.
Boston’s rate for property crime is 19 per thousand population, which is higher than the national average.
It’s Different in 2024
View this post on Instagram
As of late September 2024, Part 1 crimes (including serious offenses like robbery and assault) showed a 4% decrease compared to the same period in 2023, according to Boston Police Department reports.
Historic Low in Homicide Rates
According to the Boston Police Department, Boston saw an 82% decline in homicides compared to prior years, making it one of the lowest rates in recent history, partly due to public health and community-centered safety strategies.
Shootings Down by 10%
BPD also reported that shootings in Boston were reduced by 10% in 2024 compared to the previous year, continuing a downward trend in gun violence.
Record-Low Violent Crime Rate
According to the Vera Institute of Justice, through mid-2024, Boston experienced one of its lowest violent crime rates, attributed in part to community policing efforts and public health initiatives.
Crime Hot Spots
Certain areas of Boston have seen elevated crime rates. Notably, the downtown and Roxbury neighborhoods have reported a higher incidence of violent crimes. Data indicates that these areas experience increased firearm-related incidents and property crimes.
According to the Boston PD Crime Hub, incidents of shootings and armed robberies are more frequent in these parts. High-density population and economic disparities contribute to the crime rate variance here.
Additional police patrols and community programs have been deployed to mitigate these issues, focusing on proactive measures and community engagement to decrease violence and improve safety.
Police Presence
A few years back, Boston’s Police Department found itself in a bit of a bind with a wave of retirements depleting its ranks, as per source from above said. This situation sparked some serious concerns about whether the force could keep up with the city’s demand for safety and timely response to emergencies. But, facing these challenges head-on, there’s been a noticeable effort to bounce back, with improvements in both staffing levels and how the department operates day-to-day.
Looking into the finances, the Vera Institute points out that Boston has earmarked a whopping $431,731,291 for policing, which represents 16% of the city’s budget. That’s a significant chunk of change, breaking down to about $595 dedicated to policing for every Boston resident. With a ratio of one police department employee for every 229 people, it’s clear the city isn’t skimping on law enforcement, signaling a hefty investment in maintaining public order and safety.
The Boston Police Department’s (BPD) budget taps into a variety of sources, but it’s primarily funded through the city’s general fund. This pot of money is the main engine for the city’s operations and gets a boost from additional financial support that trickles in from local, federal, and state coffers.
This financial setup underpins everything the BPD does, from covering the cost of its workforce, training programs, and necessary equipment, to fostering community policing efforts that aim to bridge the gap between officers and the communities they serve.
Safety Perception
| Safety Concern | Perception Score | Category |
|---|---|---|
| Level of Crime | 44.23 | Moderate |
| Increasing in the Past 3 Years | 54.68 | Moderate |
| Worries of Home Being Broken Into and Things Stolen | 34.73 | Low |
| Worries of Being Mugged or Robbed | 35.55 | Low |
| Worries of Car Being Stolen | 30.45 | Low |
| Worries of Things From Car Being Stolen | 43.20 | Moderate |
| Worries of Being Attacked | 35.22 | Low |
| Worries of Being Insulted | 37.70 | Low |
| Worries of Being Subject to a Physical Attack Because of Skin Color, Ethnic Origin, Gender, or Religion | 25.68 | Low |
| Problem of People Using or Dealing Drugs | 52.99 | Moderate |
| Problem of Property Such as Vandalism and Theft | 44.63 | Moderate |
| Problem of Violent Such as Assault and Armed Robbery | 40.35 | Moderate |
| Problem of Corruption and Bribery | 39.40 | Low |
| Safety Walking Alone During Daylight | 81.43 | Very High |
| Safety Walking Alone During Night | 57.32 | Moderate |
| Overall Safety Index | 60.68 | Moderate |
Talking about Boston’s safety, it feels pretty good overall, with a Safety Index of 60.68 Based on the stats I checked out on Numbeo, it’s pretty clear. It’s like most people generally see the city as a safe place. But, of course, how safe you feel can really change based on where you are in the city, what time it is, and your own experiences.
Crime in Boston seems to be a moderate concern for many, especially with regard to things like drug use, property crimes, and violent incidents.
But on a day-to-day basis, I would feel super safe walking around during the day. Nighttime’s a bit different, with that feeling of safety dipping a bit, but still, it’s not too bad.
Safest Neighborhoods
Is Boston safe?
Boston is home to over 16 distinct neighborhoods, each with varying crime rates. Areas near the city center, which are more densely populated, tend to have higher crime rates. In contrast, neighborhoods on the outskirts often experience lower crime rates due to less population density and lower unemployment and poverty rates.
Conversely, several neighborhoods in Boston have maintained low crime rates in 2024.
Beacon Hill, Back Bay, West Roxbury, Allston-Brighton, and Roslindal are prime examples, showcasing minimal violent crime activity and fewer reports of theft.
This trend is supported by Boston’s declining murder rate, which highlights an 82% decrease in homicides citywide.
On the other hand, Central Boston, Roxbury, and the South End report higher crime rates, underscoring the importance of researching specific neighborhoods before deciding to move.
This is similar to how some areas in Chicago, such as Englewood and West Garfield Park, are known for higher crime rates and require careful consideration when relocating.
These areas benefit from strong community networks and vigilant local law enforcement, contributing to their status as some of the safest parts of the city.
The combination of neighborhood watch programs and routine police presence has fostered an environment of security and trust among residents.
Potential Causes for Crime in Boston
According to the Big Cities Health Data, Boston’s poverty rate is currently 17%, higher than the national average of 15.1%. Economic factors significantly influence crime rates, as communities with high poverty levels and income inequality often experience elevated crime.
Conversely, lower poverty rates can contribute to reduced crime levels. Population density also plays a role, with Boston’s high density of 14,259.9 people per square mile contributing to its crime rates, compared to the national average of 90.6 people per square mile.
Education is another critical factor. Higher educational attainment typically correlates with lower crime rates due to better job opportunities and alternatives to criminal behavior. In Boston, 82.8% of residents have completed high school, slightly below the national average of 83%.
Age Groups
The data indicates that individuals aged 18-24 are disproportionately involved in criminal offenses. This age group represents a peak in both property and violent crimes.
Those aged 25-34 also demonstrate a high rate of criminal activity, albeit slightly lower than their younger counterparts. In contrast, individuals over 55 are rarely implicated in crime, suggesting that younger individuals carry out most offenses.
Different age demographics contribute to various types of crime. For example, younger offenders tend to be involved in robbery and assault, while older individuals are more likely to commit fraud-related crimes. This age-related data assists law enforcement in targeting prevention programs.
Gender Statistics

Boston crime rate, males constitute a substantial majority of offenders, accounting for around 80% of recorded criminal activities. This high male involvement is consistent across various types of crime, including violent and property crimes.
Females, though less represented, have seen a slight increase in criminal activity compared to previous years. Notably, women are more involved in specific offenses like shoplifting and fraud.
Technological Advancements in Crime Detection
Boston has embraced various advanced surveillance technologies to improve crime detection. The Boston Police Department (BPD) utilizes facial recognition software to identify suspects swiftly.
Drones are also employed to monitor large public gatherings, enhancing security. This method helps capture live footage, enabling real-time decision-making.
The implementation of license plate readers has refined tracking stolen vehicles and monitoring suspicious activity.
A significant reduction in crimes such as violent crimes and shootings can be attributed to these technologies. The adoption of these tools aims for enhanced safety and crime prevention in Boston according to bostonglobe.com.
City leaders also revamped the Crime Data Hub, integrating detailed datasets on shootings, homicides, and arrests. For interactive viewing and filtering, new dashboards have been created.
The new solutions significantly contribute to current crime rate statistics.
What Do the Locals Say About Crime in Boston?

AreaVibes surveyed to gauge the perceptions of Boston residents about safety in their city.
Out of 233 responses, 57% of locals reported feeling that there was very little crime and that they felt safe walking alone at night.
Conversely, 43% felt Boston was not a safe place to live and expressed discomfort with walking alone at night.
Methodology
For my analysis of Boston’s crime rate, I mostly relied on the crime data annually published by the FBI and city police. This data is released in two key segments: a preliminary overview focused on the nation’s largest cities, followed by a detailed year-end report.
Our investigative approach centered around two principal metrics:
- Per Capita Violent Crime Rates
- Per Capita Property Crime Rates
In pursuing a nuanced examination, our study predominantly concentrated on Boston while also integrating comparative data from other Massachusetts cities for a more rounded state-wide perspective.
Final Words

Boston stands out as a relatively safe city, especially when you compare it to other large cities in the U.S.
Boston’s crime rate is just a bit above the national median, which says a lot about the community and its priorities.
The city allocates a generous budget to its police force, further reinforcing the commitment to keeping residents safe.
References
- CBS News – Boston is nation’s second safest city, according to new Gallup poll
- NeighborhoodScout – Boston, MA Crime Rates
- Boston.com – DA: Boston’s murder rate hits record-low
- Boston Police Department – Crime Statistics: January 1, 2024 – September 8, 2024 vs. 2023
- Vera Institute of Justice – Boston’s Homicide Rate Reaches a Historic Low
- Boston University – Boston’s Declining Murder Rate Lowest among Big US Cities. Is It a Fluke?
- Big Cities Health Data – Boston, MA
- HLS Harvard – Racial Disparities in the Massachusetts Criminal System
- Boston Globe – Boston outlines surveillance technology in first-ever transparency report
- AreaVibes – Boston, MA Crime Rates
- Boston Agent Magazine – Massachusetts named one of the 10 safest states in America