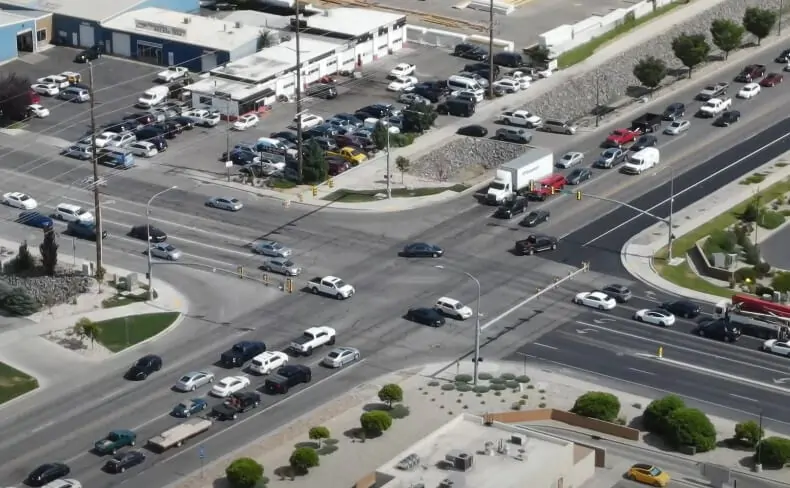

Utah’s road network is expanding fast, but its most dangerous intersections are still claiming lives and causing serious injuries every year. In urban counties along the Wasatch Front, the problem is especially visible: where cars, trucks, bikes, and pedestrians all meet in the same compressed space.
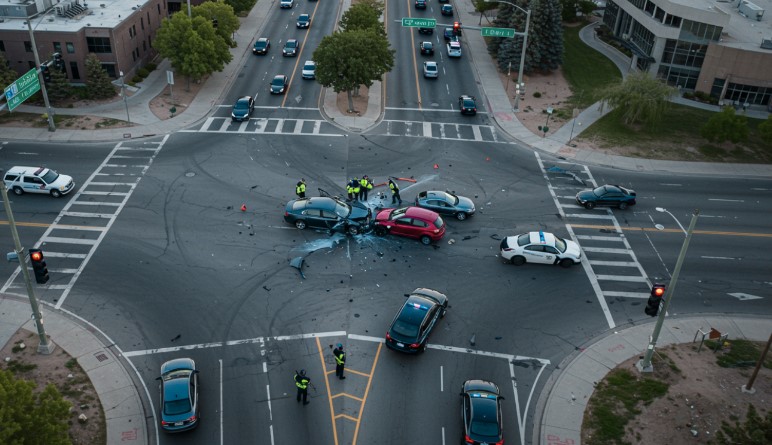
The numbers from recent safety reports are sobering. A 2024 analysis from the Wasatch Front Regional Council found that 39 percent of fatal and serious injury crashes in the region happened at intersections.
Statewide, preliminary 2024 data shows 281 people killed on Utah roads, slightly higher than the year before. About one-third of those deaths involved people walking, cycling, or riding motorcycles. That alone is a reminder that intersection safety is not just a driver’s concern.
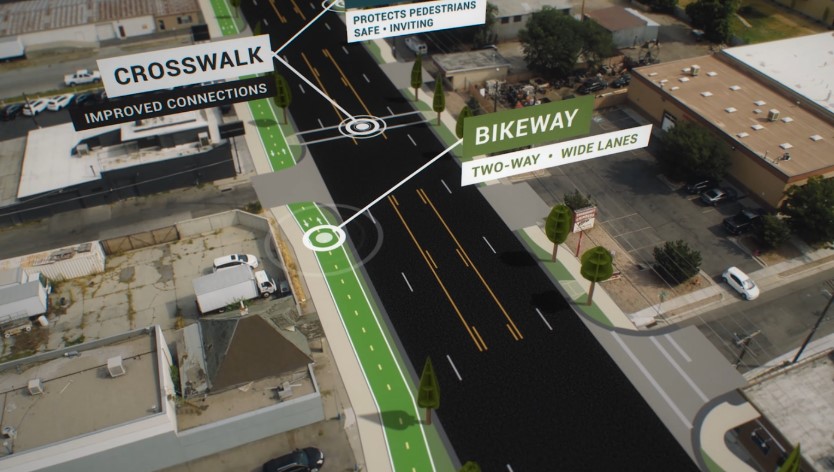
State and local agencies are leaning into a Safe System approach in 2025. The idea is straightforward: people make mistakes, so intersections should be designed to make those mistakes less likely to be deadly.
That means lower speeds, clearer separation between different movements, and layouts that are more forgiving when something goes wrong.
Utah’s Consistently Dangerous Intersections in 2025
There is no single “official” list published every January. Rankings change depending on the time period, severity weighting, and whether you focus on state highways or local streets.
But certain intersections keep showing up in UDOT records, regional safety plans, and media coverage. Those are the ones to watch this year:
1. Bangerter Highway Signalized Intersections – Salt Lake County
For decades, traffic signals on Bangerter Highway were a recipe for high-speed T-bone crashes.
UDOT has been removing those signals and replacing them with freeway-style interchanges. Intersections like 5400 South and 3500 South were notorious for severe collisions before construction began.
In 2025: Any remaining signalized intersections still carry higher risk, especially during construction. Sudden stops, shifting lanes, and drivers trying to beat yellow lights are common.
UDOT posts updates on each interchange project, and checking those before your trip can help you anticipate lane changes and detours.
2. State Street at 4500 South – Murray
One of Utah’s busiest arterials meets a high-traffic east-west road here. The result is a steady flow of rear-end and angle crashes. Add in multiple driveways and you have constant turning conflicts.
In 2025: Give extra space to the vehicle ahead and avoid sudden lane changes near the intersection. This is a location where small lapses get punished quickly.
3. Redwood Road – 4100 South to 5400 South
This stretch is a perfect example of how driveway density fuels crashes. Multiple access points, high volumes, and frequent turning lead to side-swipes and left-turn collisions. UDOT is consolidating access and clearing obstructions.
In 2025: When searching for a business here, plan on using a protected turn or a safe U-turn instead of darting across lanes to make a last-second entry.
4. 700 East at 3300 South – South Salt Lake
Historic safety studies rank this intersection near the top for severity, meaning crashes here are more likely to result in serious injury or death. The combination of speed, lane complexity, and high turning volumes is risky.
In 2025: Wait for a protected left whenever possible. Utah Intersection Safety recommends avoiding trying to squeeze through small gaps, especially when crossing multiple lanes.
5. West North Temple at Redwood Road – Salt Lake City
This wide, multi-lane intersection has recorded multiple fatalities in recent years. It is especially dangerous for pedestrians due to the width of the crossing and the volume of turning traffic.
According to a recent summary from Parker & McConkie, two fatal crashes occurred at West North Temple and North Redwood Road between 2018 and 2022.
In 2025: Approach at a speed that allows you to stop fully within your headlights’ reach at night. Look for pedestrians even when you have a green light.
6. Sunset Boulevard at Dixie Drive – St. George
Southern Utah’s population boom is creating new hot spots. This intersection has seen increased crashes due to development and event traffic.
In 2025: Expect congestion during events and peak tourist season. Build in more time for turns and avoid pushing through on late yellows.
7. University Avenue and Cougar Boulevard – Provo
Near Brigham Young University, intersections combine heavy pedestrian volumes with constant turning traffic. Lane changes and mid-block crossings add to the challenge.
In 2025: Yield to pedestrians every time. Watch for students crossing between classes, often outside marked crosswalks.
How Utah Decides Which Intersections Make the High-Risk List
Two main data sources set the state’s safety priorities.
Utah Highway Safety Office crash reports
For 2023, the state recorded 60,021 crashes, which resulted in over 26,000 injuries and 279 fatalities (per Highway Safety reports). Annual crash fact books and dashboards break those numbers down by county, crash type, and contributing factors. This helps spot long-term patterns.
UDOT crash mapping and Safety Management System
The Utah Department of Transportation runs a statewide crash location service that refreshes daily.
It uses standardized Highway Safety Manual methods to identify “areas of influence” around intersections, separate intersection-related crashes from road segment crashes, and score them for safety improvements.
Cities like Salt Lake also create High Injury Networks – maps showing the small percentage of streets where the majority of severe crashes happen. These guide grant applications and determine which projects get funded first.
Patterns That Make Intersections Dangerous
View this post on Instagram
The same design and behavior factors show up repeatedly in Utah’s worst intersections.
Multiple Wide Lanes With Permissive Left Turns
Long crossing distances and late-gap turns increase angle crash severity. Protected lefts and offset turn lanes are proven fixes.
Closely Spaced Driveways
Common on commercial corridors like Redwood Road. Consolidating access points reduces conflicts.
Speed Variability
Intersections that encourage “sprint and brake” driving, like older Bangerter segments, see more rear-ends and red-light running.
Sprint-and-brake driving raises crash risk. The good news is that when cyclists are hurt in these dangerous zones, they can turn to the Advocates to guide them legally.
High Presence of Pedestrians or Cyclists
Poor sight lines, long crossing distances, and high vehicle speeds increase the risk for vulnerable road users.
What Utah Is Doing in 2025
- Removing high-risk signals: Bangerter Highway conversions are the most visible example.
- Intersection Control Evaluation (ICE): Choosing roundabouts, protected lefts, or restricted crossing designs based on crash data, not tradition.
- Predictive modeling: Statewide safety models now use daily crash data to spot emerging trouble spots.
- Funding through High Injury Networks: Targeting the corridors with the greatest harm potential for rapid intervention.
Practical Safety Tips for Utah’s Risky Intersections
Even the best infrastructure cannot replace cautious driving, walking, or cycling. Based on Utah’s own safety research:
- Plan your approach early: Avoid last-second lane changes and get into position well before the stop bar.
- Use protected phases: Take advantage of arrows for left turns rather than attempting risky permitted turns.
- Anticipate driveway traffic: In retail corridors, expect sudden entries and exits.
- Watch for multi-threat situations: If two lanes stop for a pedestrian, check that all lanes are clear before proceeding.
- Adjust for seasonal traffic: Utah’s “100 Deadliest Days” between Memorial Day and Labor Day bring higher speeds and more out-of-town drivers.
City-by-City Highlights for 2025
- Salt Lake County: Bangerter Highway’s remaining signals, State Street, and Redwood Road top the list for crash risk.
- Utah County: University Avenue and University Parkway near campuses require extra pedestrian awareness.
- Washington County: Sunset Boulevard and Dixie Drive are priorities as the area grows.
Tracking the Data Yourself
If you want to monitor which intersections are seeing the most crashes:
- UDOT Crash Map: Updated nightly, covering crashes since 2017.
- Utah Highway Safety Office Dashboards: Annual stats by county and crash type.
- City Vision Zero Pages: Local High Injury Network maps and project lists.
Closing Thoughts
Utah’s most dangerous intersections are well known to engineers, police, and residents. In 2025, the same names keep coming up because the same risk factors remain: high speeds, complex layouts, and turning conflicts. Statewide safety strategies are targeting these places with proven countermeasures.
Until those projects are built, your best defense is patience, awareness, and margin. Lower your speed a little, leave more space than you think you need, choose the lane that avoids turning chaos, and take the green arrow when it is offered. Those small habits can make the difference between a normal commute and a crash report.