Skip to content

Open any market app lately, and the screen feels hostile. Stocks slide together. Crypto drops harder. High-yield credit looks uneasy. Even bonds, the old emotional safety blanket, have not always helped. Early February 2026 delivered several stretches that felt exactly like that.
At the same time, markets have snapped back just as sharply on some days. Deep red sessions followed by sudden rebounds confuse people and exhaust patience. That mix is not random panic. It is what high-volatility repricing looks like when expectations reset quickly.
So are all markets actually crashing, or does it only feel that way? And more importantly, does any of this point toward a prolonged slide through the rest of 2026?
Let’s slow the tape and walk through what is really happening, why so many assets moved together, and how to think about the months ahead without pretending anyone has a crystal ball.
Key Highlights
- Markets feel like they are crashing because risk assets are repricing together, driven by crowded positioning, mechanical selling, and rapid expectation resets, not pure panic.
- AI capex shocks, rate sensitivity, and fiscal pressure are the main catalysts pulling equities, crypto, and even bonds lower at the same time.
- Early 2026 volatility does not automatically mean a prolonged bear market, outcomes depend on earnings, inflation expectations, and policy stability.
- Elevated volatility is likely to persist until valuations, positioning, and growth assumptions settle into more believable ranges.
What People Mean When They Say “All Markets Are Crashing”
When investors say everything is crashing, they usually describe a specific market pattern rather than a single data point.
In a synchronized selloff, three things tend to happen at the same time.
Risk Assets Fall Together
Equities, crypto, and lower-quality credit move in the same direction because investors reduce exposure broadly. Portfolio managers are not fine-tuning positions. They are cutting risk.
When risk gets cut across the board, attention often shifts toward defensive cash strategies and questions like how to become your own bank.
Correlation Rises
Diversification helps less for a while. Assets that normally offset one another start moving together because many trades unwind at once.
Liquidity Gets Thinner
When volatility jumps, market makers and systematic strategies often step back. That can turn ordinary selling into exaggerated price moves.
According to the Bank for International Settlements, early February 2026 showed several of these features, especially around large technology and AI-linked names where expectations were high and positioning was crowded.
A Snapshot Of What Has Been Moving And Why
Below is a simplified map of the recent selloff narrative. The figures reflect widely reported moves around early February 2026 and illustrate direction rather than every single session.
| Market Area | What Moved | What Was Blamed Most Often | Why It Matters |
| US Large-Cap Equities | S&P 500 down about 1.2% on Feb 5; Nasdaq down about 1.6% on Feb 5 | Big Tech earnings, weaker data, risk-off | Index-level drops triggered broad de-risking |
| AI And Mega-Cap Tech | Large single-day drops after guidance | AI infrastructure capex shock | Valuation math reset around spend timing |
| Asia Tech-Linked Equities | Large foreign outflows in early Feb | Spillover from US tech selloff | Shows contagion from crowded themes |
| Crypto | Roughly $2 trillion market value decline since October | Deleveraging and risk appetite | Crypto behaves like high-beta risk |
| Euro Area Policy | ECB held policy rate at 2% as inflation dipped to 1.7% | Wait-and-see stance | Global rate differentials still drive pricing |
That table captures why the mood turned so dark so fast. Several large, interconnected trades broke down together.
Why Markets Can Look Like They Are “All Crashing” In 2026
The clearest explanation is a global repricing of risk triggered by a few large catalysts, then amplified by positioning and mechanical selling. Early February offered several of those catalysts at the same time.
AI Spending Plans Forced A Fast Reset In Growth Math
One of the most direct triggers came from guidance around AI infrastructure spending by major US technology firms.
Reuters reported that Amazon disclosed a 2026 spending plan reported around $200 billion versus analyst expectations around $144.67 billion.
Alphabet outlined a capex plan up to about $185 billion, reported as roughly 55% above estimates.
Reuters also reported that Big Tech rivals were collectively expected to spend more than $500 billion on AI.
Heavy spending alone is not a problem. Markets often reward investment when payoff timelines feel credible. The shock came from speed and scale.
Why that spilled beyond a few tech tickers:
- Mega-cap tech carries enormous index weight. Weakness there automatically pulls benchmarks lower.
- AI optimism has been a cross-asset theme. It sits inside equities, credit, infrastructure plays, and even parts of commodities and power markets.
- Valuation models compress when spending surges faster than revenue visibility.
The International Monetary Fund flagged a related downside risk in its January 2026 update. It warned that a reevaluation of AI expectations could trigger an abrupt correction that spreads beyond AI-linked companies.
The Rate Backdrop Can Still Shock Portfolios
Even without active rate hikes, interest rates can damage risk assets in subtle ways.
Key transmission channels include:
- Discount rate effects. Higher long-term yields reduce the present value of future cash flows, which hurts growth stocks the most.
- Duration risk in bonds. Long-duration bond funds can fall sharply when yields rise.
- Refinancing pressure in credit. Elevated borrowing costs hit weaker borrowers first.
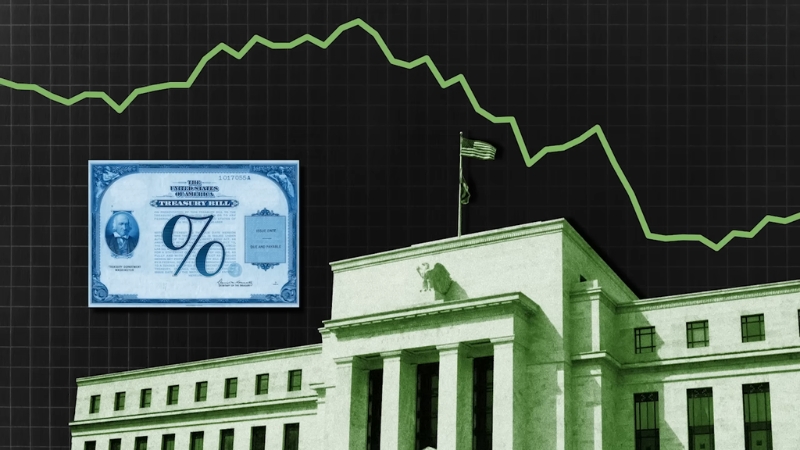
In the US, investors have watched monetary policy signals closely. The Federal Reserve noted in its January 28, 2026 statement that uncertainty around the outlook remains elevated. Markets have also reacted to debates around balance-sheet policy and rate volatility.
Fiscal Expectations Are Pressuring Long-Term Yields
Large and persistent deficits can push investors to demand higher compensation for holding long-term government debt. That tightens financial conditions without any policy-rate move.
Two widely cited reference points matter here:
- The Congressional Budget Office outlook for 2026 to 2028, which frames inflation and growth assumptions used across federal budgeting.
- The Bipartisan Policy Center deficit tracker, which highlights fiscal-year-to-date deficit figures and borrowing pace.
Fiscal watchdog commentary using early FY2026 CBO data has reinforced market sensitivity to supply and financing conditions. Investors may disagree on politics while still responding to the same pricing mechanism.
Mechanical Selling Turns Normal Selloffs Into Broad Drops
Modern markets rely heavily on rules-based strategies. When volatility spikes, those rules can accelerate declines.
Common amplifiers include:
- Volatility-targeting funds that reduce exposure automatically.
- Trend-following CTAs that sell once momentum breaks.
- Options hedging flows that push dealers to sell into weakness.
- Margin and leverage constraints that force liquidation.
The Bank for International Settlements has documented how volatility episodes and stretched valuations can overwhelm fundamentals for periods of time, even when baseline growth remains intact.
International Spillovers Travel Fast In Concentrated Trades
When US technology stocks sell off, regions tied to similar themes often follow quickly.
Reuters reported that during the first week of February 2026, foreign investors pulled about $9.79 billion from Asian stock markets, with especially large outflows from South Korea and Taiwan. The move was described as a spillover from a US tech-led selloff.
That is the source of the “everything down” feeling. Portfolios link markets through benchmarks, themes, and risk controls.
Why Bonds Might Not Save You In Every Selloff
Many investors expect bonds to rally when stocks fall. That relationship breaks down under certain conditions.
Bonds can drop during equity stress when:
- Inflation expectations remain sticky.
- Deficit-related supply pressures lift long-term yields.
- Long-duration assets get hit from both sides.
Long-duration Treasury funds can trade down sharply when yields rise. That is math, not failure.
Why Crypto Tends To Drop Harder During Risk-Off Phases
View this post on Instagram
Crypto continues to behave like high-beta risk in macro stress.
Several traits explain the pattern:
- Global liquidity and 24-hour trading make crypto an immediate source of cash.
- Embedded leverage through derivatives magnifies moves.
- Funding-rate unwinds can overshoot fundamentals.
Reuters reported that the broader decline knocked about $2 trillion off the crypto market value since October, even though sharp relief rallies appeared in early February.
Asset managers have described the pattern as deleveraging rather than a single capitulation event.
Crash Or Correction? Definitions Matter
Language shapes behavior. Precision helps.
- A correction is commonly defined as a decline of 10% from a recent peak.
- A bear market is commonly defined as a decline of 20% from a recent peak.
Several ugly sessions do not automatically equal a crash. The better question is structural.
Is the repricing:
- A valuation reset concentrated in AI and mega-cap growth?
- The start of a broad earnings recession?
- A financial-conditions shock forcing widespread deleveraging?
Those paths lead to very different outcomes.
Will The Trend Continue In 2026?
Certainty does not exist in markets. Frameworks do.
A useful way to think about 2026 is by identifying forces that keep volatility elevated versus forces that allow stabilization.
The Case For Continued Volatility
The IMF’s January 2026 update emphasized downside risks and explicitly cited reevaluation of AI productivity expectations as a potential trigger for broader market stress.
Other contributors include:
- Persistent fiscal supply pressure and term-premium sensitivity.
- Policy uncertainty and reactive central bank messaging.
- Geopolitical fragmentation as a macro risk theme.
The World Economic Forum 2026 Global Risks Report highlighted geoeconomic confrontation as a severe near-term risk category.
That reinforces the idea that policy shocks can keep markets unstable even without a recession.
The Case For Stabilization Later In 2026
Stabilization often comes from predictability rather than optimism.
Key ingredients include:
- Earnings guidance is settling into believable ranges.
- Inflation expectations remain anchored.
- Volatility is declining enough to calm systematic selling.
- Markets are accepting new valuation bands for crowded themes.
We are in a good place, and inflation is in a good place, said President @Lagarde after the Governing Council decided to keep interest rates unchanged at today’s press conference. pic.twitter.com/hQ6dK1kTW2
— European Central Bank (@ecb) February 5, 2026
On the euro area side, the European Central Bank has emphasized that inflation expectations remain anchored and described policy as being in a good place, even amid brief volatility spikes.
Global liquidity conditions matter greatly for whether shocks spiral.
Three Plausible Scenarios For 2026
| Scenario | What It Looks Like | What Must Hold | What Would Break It |
| Base Case: Choppy And Range-Bound | Repeated drawdowns and rebounds | Growth slows without deep contraction | Inflation surge or credit shock |
| Downside: True Bear Market | Sustained broad declines | Earnings revisions cascade | Policy response or rapid disinflation |
| Upside: Volatility Fades | Smaller pullbacks | AI payoff timelines clarify | New capex shock or escalation |
The IMF framing is helpful. It does not argue that AI investment is flawed. It warns that expectation resets can cause abrupt corrections.
What To Watch Week To Week
Headlines mislead. Signals matter.
Market Signals
- Credit spreads. Persistent widening suggests stress moving toward the real economy.
- Long-end yields and auctions. Supply-driven yield moves differ from growth-driven ones.
- Earnings revisions. Aggregate forward EPS matters more than individual beats.
- Breadth. Narrow leadership increases fragility.
- Positioning. Forced selling often precedes violent rebounds.
Policy And Macro Signals
- Central bank language around uncertainty and inflation paths.
- Fiscal borrowing pace and financing conditions.
- Global flashpoints that affect energy, shipping, or trade.
Reuters reporting around tech capex, Asian spillovers, and shifting rate expectations has shaped how markets interpret recent volatility.
Practical Takeaways
Market stress exposes structure.
A few risk-control principles tend to matter most during correlated selloffs:
- Know concentration. Many portfolios lean heavily into mega-cap growth more than owners realize.
- Review duration. Long-duration bond funds can lose money during equity stress.
- Respect leverage. Volatility turns leverage into forced selling.
- Separate liquidity from conviction. Cash needed within 6 to 12 months does not belong in assets that can drop 5% in a day.
- Rebalance with rules. Predefined triggers prevent adrenaline-driven decisions.
Final Thoughts
@fellasfinance Will the stock market crash in 2026? #stockmarket #investingtips #personalfinance ♬ original sound – Fellas Finance
Markets feel brutal when correlations rise, and familiar hedges fail. Early 2026 has delivered exactly that kind of environment. The drivers are visible: AI spending shocks, rate sensitivity, fiscal pressure, mechanical selling, and global spillovers.
None of that guarantees a prolonged collapse. It does suggest that volatility may remain part of the landscape until expectations reset and positioning clears.
Stability tends to return quietly, not with headlines. The work for investors is less about guessing the bottom and more about building portfolios that survive ugly stretches without forcing bad decisions.