Skip to content

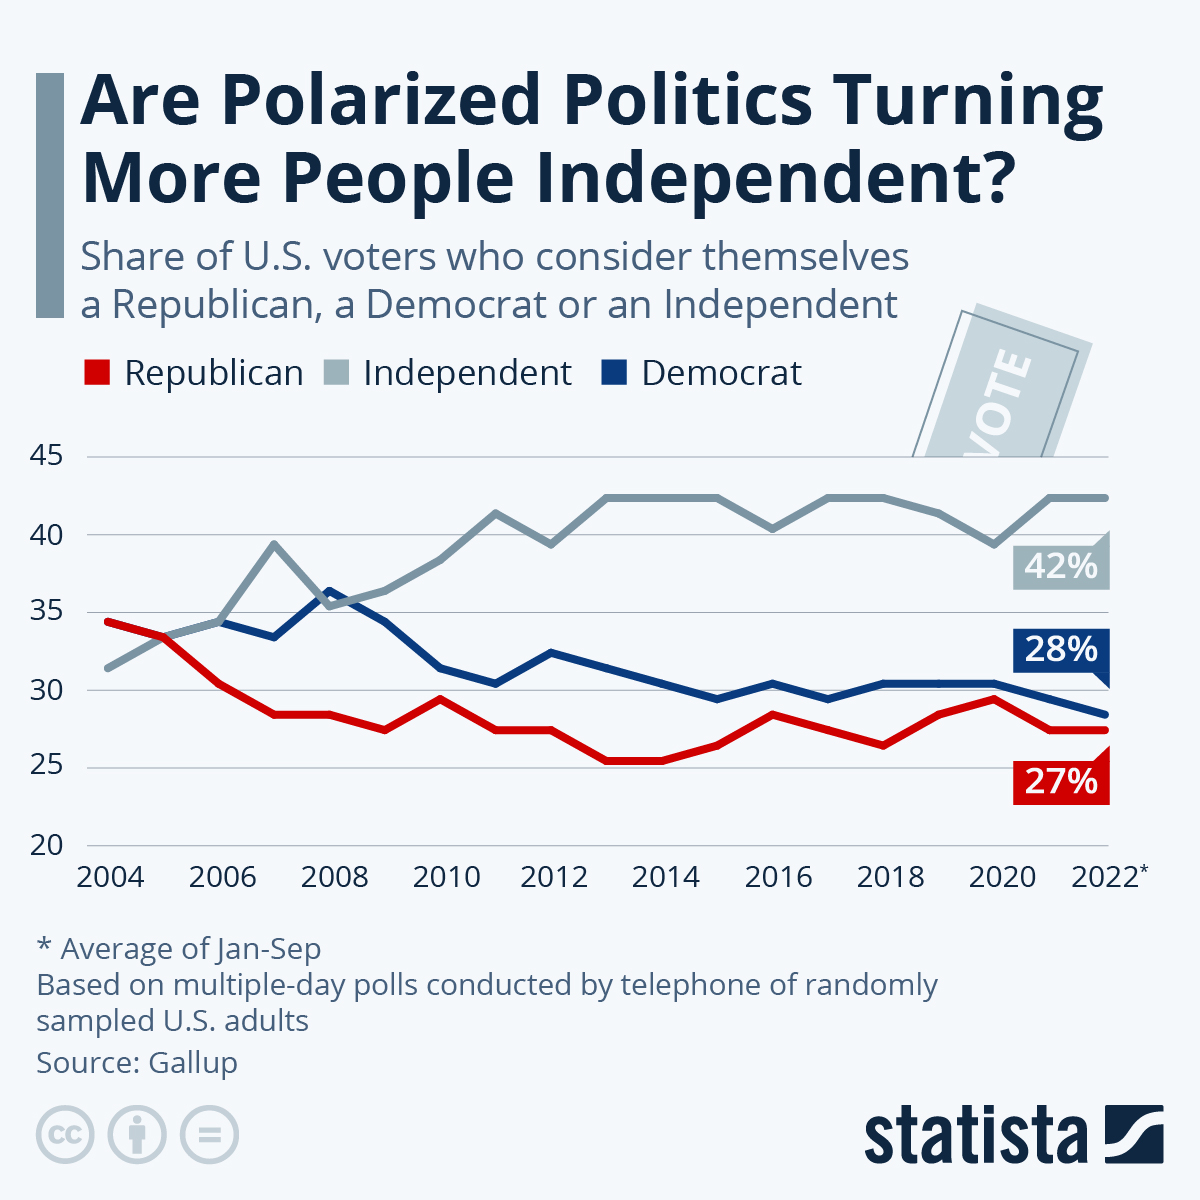
The seemingly everlasting battle between Red and Blue has just taken an interesting turn. A growing share of Americans are rejecting major-party labels and choosing “independent” instead.
In the latest full-year polling summary, 45% of U.S. adults identified as independents in 2025, while Democrats and Republicans each registered at 27%. “ A record-high 45% of U.S. adults identified as political independents in 2025,” the release states.
That headline sounds like a public breaking away from partisanship. The deeper takeaway is more specific: a rising “independent” label does not automatically mean a politically unaligned electorate. Most independents still lean toward a party, and those leaners shape the real balance of power.
The Basic Split, Independents at 45%, Parties Tied at 27% Each
 You will find more infographics at Statista
According to Gallup’s summary we just mentioned, the core distribution is simple:
- Independent: 45%
- Democrat: 27%
- Republican: 27%
The same report notes the prior high was 43% in 2014, 2023, and 2024, meaning the 2025 figure is a new peak in its annual tracking.
A mainstream retelling underscores how large the independent label has become. “ Just under half, 45%, of U.S. adults now identify as independents,” AP reported, framing it as a longer-running trend rather than a one-year blip.
“Independent” Is a Label, the Leaners Tell You Who They Usually Side With
The most important part of the measurement comes after a respondent says “independent.” The follow-up question asks which party they lean toward, if either. In the 2025 annual results, the independent bloc breaks down like this:
- 20% Democratic-leaning independents
- 15% Republican-leaning independents
- 10% independents who do not lean
So, the “independent” group includes people who function like partisans in practice, plus a smaller slice who truly refuse to lean.
Pew Research Center’s work points in the same direction, using a different dataset and timeframe. Pew writes that “ an overwhelming majority of independents (81%) ” lean toward one party or the other.
Academic research also treats leaners as reliably partisan in behavior. A study on independent leaners summarizes the pattern bluntly: “ Leaners vote like outright partisans. ”
If you want to know whether “independent America” is genuinely unattached or simply rebranding, the leaner split is the first place to look.
When Leaners Are Included, One Side Has a Clear Edge
To translate labels into a more election-relevant picture, the polling summary combines party identifiers with same-side leaners into “party affiliation.” In 2025, that leaned measure shows:
- 47% Democrats or Democratic-leaning independents
- 42% Republicans or Republican-leaning independents
AP reported the same leaned distribution, noting that nearly half identify as Democrats or lean that way, compared with a smaller share on the Republican side.
For analysts, that leaned figure often matters more than the standalone 45% because it clarifies how “independents” sort when a binary choice is unavoidable.
Why the Independent Label Keeps Growing, a Cohort Story More Than a Mood Swing
The polling summary explicitly ties the rise in independence to generational patterns. It reports majorities of Gen Z and millennials identify as independents, and it makes a cohort comparison that suggests the pattern is not only a life-stage phase.
The report states: “ The 56% of Gen Z adults identifying as independents today compares with 47% of millennials in 2012 and 40% of Gen X adults in 1992. ”
That is a big deal for party coalitions. If cohorts carry a stronger independent identity forward as they age, the parties are competing in a landscape where more voters resist formal party membership even when their voting behavior remains predictable.
How the Polling Is Conducted, and What That Means for Confidence
Any strong claim about trend movement needs a clear sample description. The release states the annual estimates are based on “ interviews with more than 13,000 U.S. adults throughout the year .”
For its broader U.S. trend polling approach, Gallup’s methodology documentation describes “ a dual-frame design ” that includes landline and cellphone numbers, plus Spanish-language interviewing for primarily Spanish-speaking respondents.
A full-year sample of 13,000+ supports stable annual estimates. The caution is about reading too much into short-term movements without seeing the uncertainty bounds. Annual averages help dampen the noise, but party identification can still respond to major events and perceptions of leadership.
What to Take Away if You Are Trying to Interpret the 45% Figure
- The independent label is at a modern high in the annual tracking, and it is not a fringe identity anymore.
- The independent category contains leaners and non-leaners. In the annual breakdown, 10% are non-leaning independents, while 35% are leaners.
- External research reinforces that most independents lean and often behave like partisans in vote choice.
- If you want a clearer picture of partisan advantage than labels alone, the leaned “party affiliation” split is the useful indicator, and it is 47% Democratic or Democratic-leaning vs 42% Republican or Republican-leaning in 2025.