Skip to content

Marriage isn’t just a personal milestone—it’s also a mirror reflecting culture, economics, and social structure. When we zoom in on how long marriages last across the U.S., state by state, a fascinating picture emerges.
Whether you’re a policymaker, a relationship counselor, or someone just curious about how your state stacks up, the data offers more than just numbers—it tells stories about who we are, how we live, and what shapes long-term relationships.
Put simply, the average marriage in the U.S. lasts about 20 years, but that number can change a lot depending on where you live, and we’ll break down those differences as we go.
Let’s get started.
Key Highlights
- Vermont leads the nation with the longest average marriage length at 23.1 years.
- Washington, D.C. has the shortest average marriage length at just 10.8 years.
- Utah is an outlier, with longer marriages despite having the youngest median age.
- Divorce rates are falling nationally, and people are marrying later than ever before.
The Latest We’ve Got & Why 2023 Data Still Matters in 2025
#ICYMI: Is your state in step with national #marriage and #divorce trends?
Rank and compare divorce and marriage rates in your state to those in other states and the nation with our #DataVisualization.
▶️ https://t.co/PIKk78uUck#AmericaCounts #ACSdata #AmericanCommunitySurvey pic.twitter.com/Sue1orDdUd
— U.S. Census Bureau (@uscensusbureau) July 17, 2023
As of May 2025, the most up-to-date, comprehensive stats on average marriage length by state come from the U.S. Census Bureau’s 2023 American Community Survey, summarized by USA Facts.
While it’s tempting to wait for fresher figures, the trends tend to move slowly, so 2023 is still a solid proxy for understanding where things stand.
Who’s Staying Married the Longest?
Let’s start with the leaders. The states with the longest average marriage durations share a few things in common: older populations, tight-knit communities, and lower divorce rates.
| State | Average Marriage Length (Years) | Median Age |
| Vermont | 23.1 | 43.4 |
| Wisconsin | 22.7 | Not Provided |
| New Hampshire | 22.6 | 43.4 |
Vermont stands out not just for its picturesque landscapes, but for its marital staying power. With a median age of 43.4 and a low divorce rate of 4.4 per 1,000 people, couples in Vermont appear to stick it out for the long haul.
The same goes for neighboring New Hampshire and Midwestern Wisconsin, both boasting marriage lengths above 22 years.
And Who’s Not?
Now for the other end of the spectrum.
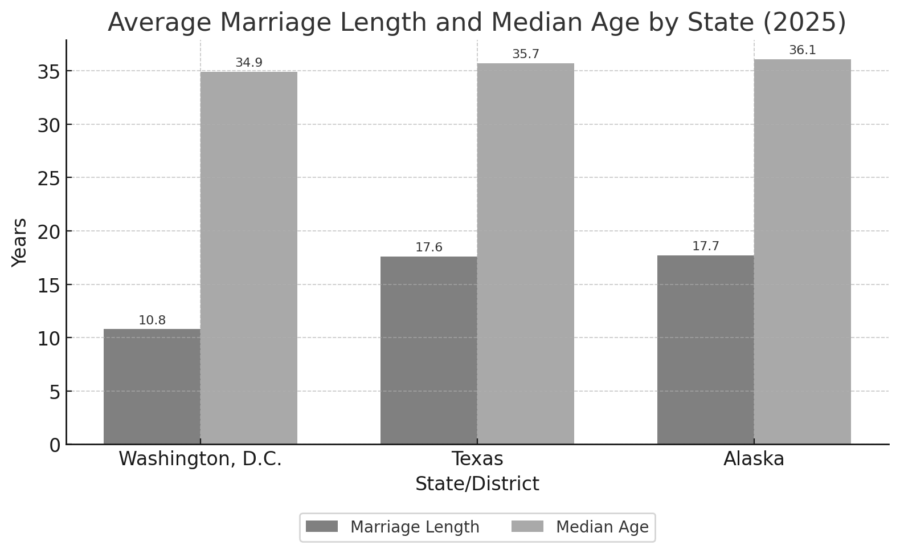
Washington, D.C. is in a category of its own. The average marriage here lasts only 10.8 years. Given D.C.’s younger, highly mobile workforce and high cost of living, it’s not exactly surprising.
Texas and Alaska, with younger populations and relatively high divorce rates, also land on the shorter side of the national spectrum.
Utah Offers An Interesting Outlier
Utah deserves its own spotlight. While the data didn’t specify an exact number, it’s noted that Utah has longer-than-average marriages relative to its young median age—the youngest in the country.
Cultural and religious influences, particularly from the Mormon community, likely play a role. Marriage is often entered into younger and with strong family support networks.
State-by-State Marriage and Divorce Rates
Here are the state-by-state marriage and divorce statistics, based on the data published by USA Facts:
| State | Marriage Rate | Divorce Rate |
| Washington, DC | 22.5 | 5.3 |
| Utah | 21.9 | 7.8 |
| Alaska | 20.9 | 9.9 |
| Colorado | 20.9 | 7.6 |
| Kentucky | 20.7 | 8.5 |
| Indiana | 20.3 | 7.9 |
| Tennessee | 20.1 | 7.7 |
| Kansas | 19.6 | 6.5 |
| Texas | 19.5 | 7.3 |
| Vermont | 18.9 | 4.4 |
| Mississippi | 18.7 | 8.6 |
| Nebraska | 18.6 | 6.6 |
| Montana | 18.5 | 7.1 |
| Washington | 18.5 | 6.3 |
| Hawaii | 18.5 | 5.6 |
| North Carolina | 18.5 | 6.2 |
| Oregon | 18.4 | 8.1 |
| West Virginia | 18.3 | 8.5 |
| Arizona | 18.2 | 6.9 |
| Maryland | 18.1 | 7.4 |
| North Dakota | 18.1 | 9.0 |
| Florida | 18.0 | 7.5 |
| South Dakota | 17.8 | 5.1 |
| Alabama | 17.8 | 8.6 |
| Oklahoma | 17.7 | 8.8 |
| Missouri | 17.6 | 7.7 |
| Idaho | 17.6 | 8.0 |
| Georgia | 17.6 | 7.4 |
| Massachusetts | 17.2 | 6.7 |
| Virginia | 17.1 | 6.5 |
| New Jersey | 16.8 | 5.8 |
| Nevada | 16.7 | 9.3 |
| Iowa | 16.5 | 6.4 |
| Wisconsin | 16.4 | 5.7 |
| Illinois | 16.4 | 6.0 |
| New York | 16.3 | 5.9 |
| California | 16.3 | 5.9 |
| Pennsylvania | 16.3 | 5.8 |
| South Carolina | 16.2 | 7.0 |
| Minnesota | 16.1 | 6.4 |
| Arkansas | 16.1 | 8.5 |
| Wyoming | 16.0 | 9.7 |
| Ohio | 15.9 | 6.4 |
| New Hampshire | 15.8 | 5.9 |
| Michigan | 15.7 | 6.2 |
| Maine | 14.8 | 6.3 |
| Connecticut | 14.6 | 5.1 |
| Rhode Island | 14.4 | 6.0 |
| Louisiana | 13.9 | 6.0 |
| New Mexico | 13.9 | 7.3 |
| Delaware | 12.8 | 9.3 |
Delaware and New Mexico have some of the lowest marriage rates but relatively high divorce rates, which may reflect either smaller married populations or more fragile unions.
National Marriage Duration Trends
Beyond state lines, broader research helps fill in the gaps.
According to the National Center for Family & Marriage Research at Bowling Green State University:
- First marriages last a median of 21 years.
- Second marriages tend to last around 17 years.
- Third or later marriages drop to just 13 years on average.
Other key insights:
- White Americans have the longest median marriage durations (22 years).
- Marriage duration is not always longer among the highly educated. In fact, those without college degrees average longer marriages—22 years vs. 17 years for those with a bachelor’s degree.
Why Does It Vary So Much By State?

1. Age Demographics
States with older populations, like Vermont and New Hampshire, naturally have longer average marriage lengths. More people are further into their marriages, which pulls the average up.
2. Cultural Values
States like Utah showcase how culture plays a role. Religious communities often place a stronger emphasis on marital longevity, providing both social support and institutional encouragement for staying married.
3. Economic Stability
Where money’s tight, marriage can be tougher. States with high living costs or less economic opportunity may see higher rates of marital stress, and therefore, shorter marriages.
D.C. is a good example: high stress, high mobility, high turnover.
4. Urbanization and Education
More urbanized and educated areas often see people marrying later.
While marrying later is generally tied to more mature relationships, urban living also brings higher rates of divorce, possibly due to greater individualism and access to legal resources.
Examples – Four Different States, Four Different Stories

Vermont
- Average Marriage Length: 23.1 years
- Median Age: 43.4
- Divorce Rate: 4.4 per 1,000
Tucked away in New England, Vermont’s story is one of quiet consistency. With a stable, aging population and strong community values, it offers a model for marital longevity.
Texas
- Average Marriage Length: 17.6 years
- Median Age: 35.7
- Divorce Rate: 7.3 per 1,000
Texas is large, diverse, and fast-paced. The state’s youth and economic churn could contribute to shorter marriages—though its rate isn’t among the worst.
Washington, D.C.
- Average Marriage Length: 10.8 years
- Median Age: 34.9
- Divorce Rate: 5.3 per 1,000
A hub for young professionals and policy wonks, D.C.’s lifestyle doesn’t lend itself to long-lasting marriages. High cost of living, job relocations, and transient populations can cut relationships short.
Utah
- Average Marriage Length: Not specified (longer relative to age)
- Median Age: Youngest in the U.S.
- Divorce Rate: 7.8 per 1,000
What Utah lacks in exact data, it makes up for in cultural influence. Family and religious values encourage early and lasting marriages, making it an outlier worth watching.
What Does This Mean For You?
View this post on Instagram
If You’re a Policymaker
You can’t improve what you don’t measure. States like Alaska or Texas might consider investing in marriage education and counseling programs, particularly in regions with high divorce rates.
Conversely, Vermont might shift resources toward aging couples and elderly care.
If You’re Just Curious
Average marriage length doesn’t predict your personal relationship, but it can reveal what kind of cultural and economic context you’re living in.
If you’re in a state with short marriage durations, seeking out relationship resources early could be a smart move.
If You Work in Public Health
Longer, stable marriages are tied to better health outcomes. Understanding where the risks lie—whether due to economic instability or social fragmentation—can help direct preventive care and community outreach.
What’s Coming Down the Road?
@nowthis Why are people getting married at a later age today than they did in the ‘80s? #marriage #nowthis #relationships ♬ original sound – nowthis
1. People Are Marrying Later
Over the decades, the average age at first marriage has risen dramatically—from around 22 for men and 20 for women in the 1950s, to 30 and 28 today, as per Brides. That delay often translates to better preparedness and more stable relationships.
2. Divorce Rates Are Falling
The national divorce rate has dropped from six per 1,000 in 2000 to under three per 1,000 by 2021. That downward trend may continue, especially as people marry more selectively.
The crude divorce rate decreased to 2.5 per 1,000 people, based on data from the CDC.
3. Technology’s Role Is Growing
From dating apps to long-distance video calls, technology is reshaping how relationships start and evolve.
It may reduce marriage rates but also help sustain long-distance relationships, adding new variables to long-term marital dynamics.
4. Cultural Norms Are Evolving
With growing acceptance of cohabitation, LGBTQ+ unions, and non-traditional partnerships, marriage as an institution is adapting.
That evolution may influence not just who marries, but how long those marriages last. Divorce rates in the LGBTQ+ community are also different story altogether.
Methodology
- I started by pulling the most recent state-level marriage duration data from the 2023 American Community Survey via USAFacts.
- Then I cross-referenced those stats with median age and divorce rates to find patterns and outliers.
- I added context using national-level research from sources like the CDC and Bowling Green State University.
- I used real-world examples from states like Vermont, Texas, and D.C.
Final Thoughts

Looking at average marriage length by state offers more than a numbers game—it provides a meaningful glimpse into how people live, love, and grow together across the country.
Whether you’re in Vermont or D.C., your environment shapes your experiences—but so do your choices. As more data comes out in late 2025, we’ll get an even clearer picture.
Until then, the 2023 figures offer a valuable foundation for anyone hoping to understand—or improve—the state of marriage in their own corner of the U.S.
References
- usafacts.org – How does marriage vary by state?
- bgsu.edu – Median Duration of Marriages in the U.S.
- brides.com – What Is the Average Age of Marriage in the U.S. in 2025?
- cdc.gov – Marriage and Divorce