

Talking about the “most liberal” cities in the United States always sounds simpler than it really is. People use the phrase to point at voting results, local policies, cultural attitudes, or a general political vibe. Often enough, people tend to point towards the battle between Red and Blue as well.
For a clear and defensible snapshot in 2025, the most solid anchor is recent presidential voting, paired with a realistic definition of what counts as a city in official election data. That approach keeps the discussion grounded and avoids fuzzy impressions or stereotypes.
With that said, we prepared a data-first, city-by-city look at the most liberal urban jurisdictions in the United States as of 2025, based on official 2024 presidential election returns and the broader political geography that shapes them. Let’s get into the details.
Key Points
- “Most liberal” is defined using two-party Democratic share from certified 2024 presidential results, not cultural perception or stereotypes.
- Washington, DC, ranks first by a wide margin at 93.3% Democratic, followed by San Francisco, Manhattan, and Portland.
- Rankings rely on practical election jurisdictions like city-counties or urban-core counties to ensure comparable data.
- Large urban centers skew liberal due to demographics such as renters, younger voters, diversity, and high education levels.
What “Most Liberal” Means in Practical Terms
Before ranking anything, it helps to be explicit about the yardstick.
- A place that votes overwhelmingly for Democratic candidates.
- A population that self-identifies as left-of-center on social and economic issues.
- A local government that pursues progressive policy goals around housing, transit, climate, labor, or public health.
For a 2025 snapshot that holds up under scrutiny, presidential voting margins remain the cleanest and most comparable signal across states and regions.
The Metric Used Here
The ranking relies on the two-party Democratic share in the 2024 presidential election:
Democratic votes divided by the sum of Democratic and Republican votes.
Using a two-party share keeps comparisons consistent across states that list multiple minor parties or allow extensive write-ins. It also reduces noise caused by ballot design differences.
What Counts as a “City”
- City-counties where the city and county are the same, such as San Francisco.
- Urban-core counties that function as the political center of a metro area, such as King County for Seattle or Multnomah County for Portland.
- Borough-counties for New York City, which are reported separately in certified state results.
The goal here is not to stage a boundary debate, but to compare major urban electorates using official returns that actually exist.
Why Large Cities Skew Liberal
The patterns behind the rankings are not mysterious.
- Renters and residents facing housing cost pressure.
- Younger adults and students.
- Racially and ethnically diverse communities.
- High shares of college-educated residents.
- Workers in public sector, education, healthcare, tech, and nonprofit roles.
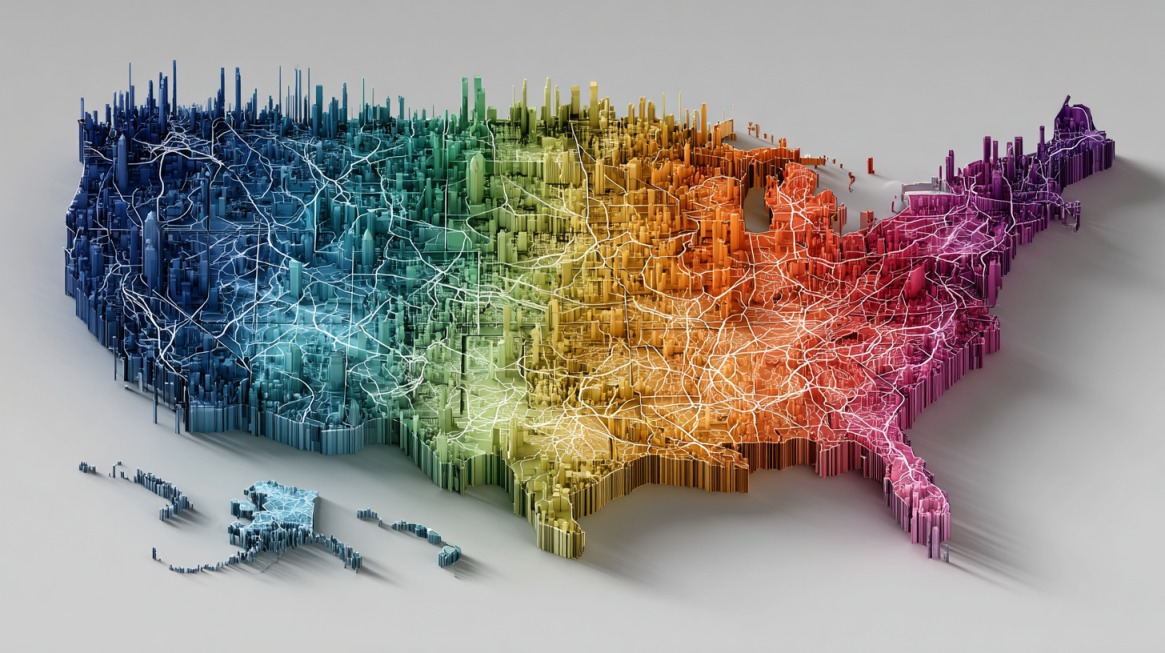
National research consistently shows that partisan divides track strongly with where people live, with dense urban cores leaning heavily Democratic compared with suburbs, small towns, and rural areas.
In the most liberal cities, politics often becomes an internal conversation inside a broad left-of-center coalition rather than a close two-party contest.
Top Liberal City Jurisdictions by 2024 Vote
Based on the certified 2024 presidential results and the two-party Democratic share, several cities and city-regions stand out clearly.
The Two-Party Democratic Share
| Rank | City or jurisdiction used | The two-party Democratic share |
| 1 | Washington, DC (district-wide) | 93.3% Official Source |
| 2 | San Francisco, CA (San Francisco County) | 83.8% Official Source |
| 3 | Manhattan, NY (New York County) | 82.4% Official Source |
| 4 | Portland, OR (Multnomah County) | 82.2% Official Source |
| 5 | Seattle area, WA (King County) | 76.8% Official Source |
| 6 | Madison area, WI (Dane County) | 76.3% Official Source |
| 7 | Ithaca, NY (Tompkins County) | 75.3% Official Source |
| 8 | The Bronx, NY (Bronx County) | 72.7% Official Source |
| 9 | Brooklyn, NY (Kings County) | 72.0% Official Source |
| 10 | Boston area, MA (Suffolk County) | 62.8% Official Source |
| 11 | Queens, NY (Queens County) | 62.3% Official Source |
In New York jurisdictions, Democratic votes include both Democratic and Working Families ballot lines, while Republican votes include Republican and Conservative lines. Adding those together provides a clearer head-to-head comparison.
City Profiles and Political Context
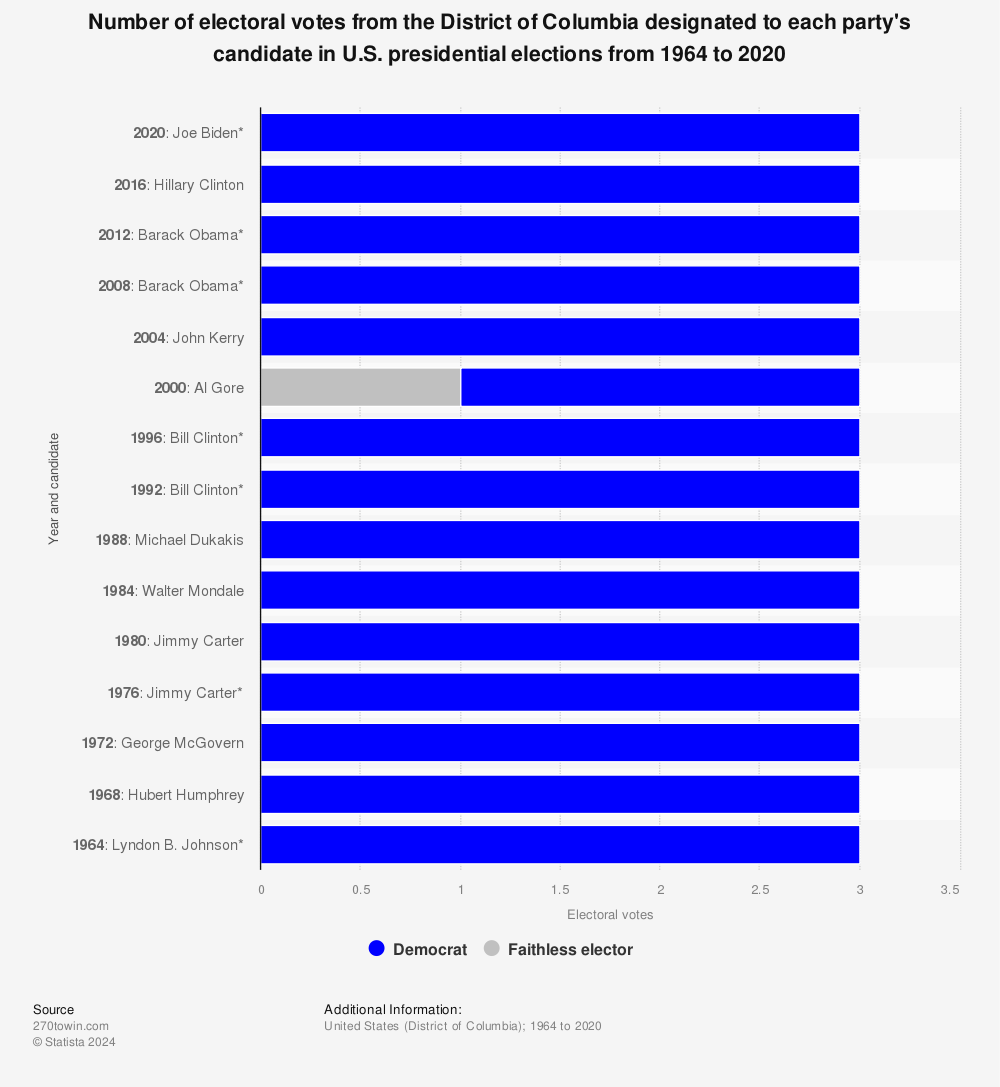
Washington, DC
Washington, DC, sits in a category of its own. Certified 2024 results show 294,185 votes for the Democratic ticket and 21,076 for the Republican ticket . On a two-party basis, that works out to 93.3% Democratic.
No other major U.S. jurisdiction comes close to that margin in modern presidential politics.
- An electorate shaped heavily by federal employment and adjacent professional sectors.
- High educational attainment.
- A political culture where Democratic primaries often serve as the main competitive elections.
DC’s liberal identity is deeply embedded and stable across election cycles.
San Francisco, California
San Francisco offers one of the cleanest cases for city-level analysis because the city and county are the same entity.
Final 2024 results show 323,719 votes for the Democratic ticket and 62,594 for the Republican ticket . On a two-party basis, that yields an 83.8% Democratic share .
San Francisco’s reputation rests not only on national election margins but also on its internal political spectrum.
Many local debates unfold inside a broadly progressive baseline, with disagreements centered on how policy goals should be pursued rather than whether they should exist.
Manhattan, New York
Manhattan stands out even within New York City.
When Democratic and Working Families lines are combined, and Republican and Conservative lines are combined, Manhattan’s two-party Democratic share reaches 82.4% . That places it in the same tier as the bluest city-counties nationwide.
The borough’s density, wealth disparities, transit reliance, and concentration of cultural and political institutions all shape a political climate that consistently produces overwhelming Democratic margins.
Portland, Oregon
Multnomah County functions as Portland’s political core and provides a clear window into the city’s lean.
Official returns show 325,927 Democratic votes and 70,759 Republican votes , producing an 82.2% two-party Democratic share .
Portland’s role in Oregon politics is outsized. Strong Democratic margins in Multnomah County often offset deep Republican support in many rural counties, making the Portland metro area central to statewide outcomes.
Seattle Area, Washington
King County anchors the Seattle region and is one of the largest liberal urban electorates in the country.
In 2024, the Democratic ticket received 832,606 votes compared with 252,193 for the Republican ticket . That translates to a 76.8% two-party Democratic share .
King County’s importance comes from scale as much as margin. Its electorate is large, diverse, and influential in shaping Washington state politics, especially on issues like transportation, housing growth, and climate policy.
Madison Area, Wisconsin

Dane County combines a state capital with a major research university, a combination that reliably produces strong Democratic results.
Certified returns show 273,995 votes for the Democratic ticket and 85,454 for the Republican ticket . The two-party Democratic share stands at 76.3%.
Madison often operates as Wisconsin’s liberal counterweight to more conservative regions, and its margins reflect the presence of students, public sector workers, and research institutions.
Ithaca, New York
Tompkins County, anchored by Ithaca, appears on the list despite its small size.
When Democratic and Working Families votes are combined and compared with Republican and Conservative votes, the county reaches a 75.3% two-party Democratic share .
Ithaca’s political identity is shaped by higher education institutions and a long tradition of progressive local organizing. It shows how deeply liberal voting patterns can take hold even outside major metros when the local ecosystem supports them.
The New York City Borough Pattern
Treating New York City as a single political unit hides important variation across boroughs.
- Manhattan: 82.4% Democratic
- Bronx: 72.7% Democratic
- Brooklyn: 72.0% Democratic
- Queens: 62.3% Democratic
Manhattan competes with San Francisco and Portland for the highest margins, while Queens remains solidly Democratic but less lopsided.
Boston Area, Massachusetts
Suffolk County serves as a reasonable proxy for Boston’s urban core.
In 2024, the Democratic ticket received 237,462 votes compared with 140,363 for the Republican ticket . That results in a 62.8% two-party Democratic share .
Boston’s margins are not as extreme as DC or San Francisco, yet the city remains firmly anchored in the Democratic column and plays a central role in Massachusetts’ political identity.
What Makes a City Liberal Beyond Voting

Election margins provide clarity, but they do not capture everything residents experience day to day. Cities that consistently rank as the most liberal often share several traits.
Urban Political Geography
Dense land use and transit-oriented living tend to push issues like housing affordability, public transportation, and environmental resilience to the forefront. That shapes governance preferences and voting behavior over time.
Local Political Ecosystems
In the bluest jurisdictions, political competition often shifts inward. Primaries, coalition building, and policy debates inside the broader left-of-center spectrum matter more than general election contests.
- Strong progressive wings within local Democratic parties.
- Active labor unions and nonprofit networks.
- High civic engagement around city-specific issues.
Anchor Institutions
- Universities and research hospitals.
- Large public sector employment bases.
- Cultural and nonprofit organizations with national reach.
DC represents the most extreme example, while places like Madison and Ithaca show how similar dynamics play out on a smaller scale.
Three Useful Ways to Read “Most Liberal” in 2025

Different readers look for different meanings when scanning lists like this. Three practical lenses help clarify the picture.
Pure Election Margin
If the focus is on places that come closest to one-party Democratic presidential voting, Washington, DC, and San Francisco sit at the top based on certified 2024 data.
Big-City Influence
If the emphasis is on cities that shape statewide outcomes and national narratives, King County and Multnomah County stand out because they pair strong Democratic margins with large electorates.
Progressive Infrastructure
If the interest lies in deeply embedded progressive institutions rather than sheer population size, Dane County and Tompkins County deserve attention despite their smaller scale.
Limits of the Ranking
No ranking captures every dimension of political identity.
- County-level data can blur distinctions between city cores and surrounding neighborhoods.
- A single election offers a snapshot rather than a lifetime guarantee.
- Ballot structures vary by state, especially in places like New York, where multiple party lines exist.
Still, using certified 2024 presidential results provides a solid and transparent baseline for comparing liberal urban jurisdictions in 2025.
Closing Thoughts
The most liberal cities in the United States share more than just high Democratic vote shares. They reflect long-term patterns in urban life, institutional presence, and political culture.
Washington, DC, and San Francisco anchor the top end of the scale, while places like Portland, Seattle, Madison, and key New York boroughs illustrate how liberal politics takes root across different sizes and regions.
Seen through official election data and real urban context, the picture in 2025 is consistent, measurable, and far from accidental. For the bigger picture, on an international level, you can also check statistics that display the Democracy Index across the globe.