
As of June 26, 2025, the inflation rate in the United States is sitting at 2.4% for the 12 months ending in May, according to the Consumer Price Index for All Urban Consumers (CPI-U).
That’s a tick up from April’s 2.3%, and while it’s nothing to panic over, it’s enough to keep economists, policymakers, and everyday consumers on their toes.
At first glance, 2.4% might seem like just another economic number. But for households trying to manage grocery bills, fill up their gas tanks, or replace a refrigerator, inflation is a lived experience, not just a statistic.
Let’s break down what’s happening with prices in 2025, why they’re moving, and what it means going forward.
Key Highlights
- U.S. inflation rate in May 2025 is 2.4%, slightly up from April’s 2.3%.
- Food prices are rising (2.9% YoY) while gas and airfare have dropped.
- Tariffs are pushing up costs for appliances and other imports.
- Inflation varies by region, with San Diego hitting 3.8%.
Inflation 101 & How It’s Measured in the U.S.
Inflation refers to the rate at which the general level of prices for goods and services is rising. As inflation goes up, each dollar buys a bit less than it did before.
The Consumer Price Index (CPI) is the most widely followed measure of inflation. It’s compiled by the Bureau of Labor Statistics (BLS) and reflects the price changes of a broad “basket” of everyday items—everything from food and gas to healthcare and housing.
It’s meant to capture the experience of urban consumers, covering about 90% of the U.S. population.
There are two main versions of the CPI to pay attention to:
- Headline Inflation: This includes all items in the basket—food, energy, rent, you name it.
- Core Inflation: This excludes food and energy because they can swing wildly from month to month. Core inflation is useful for spotting longer-term trends.
For May 2025:
- Headline CPI: 2.4%
- Core CPI: 2.8%
- PCE Price Index (Fed’s preferred measure): 2.1% in April 2025
What’s Driving Inflation Right Now?
Even when the overall inflation number looks tame, not all prices are moving in the same direction. Some are up, some are down, and some are moving faster than you might expect.
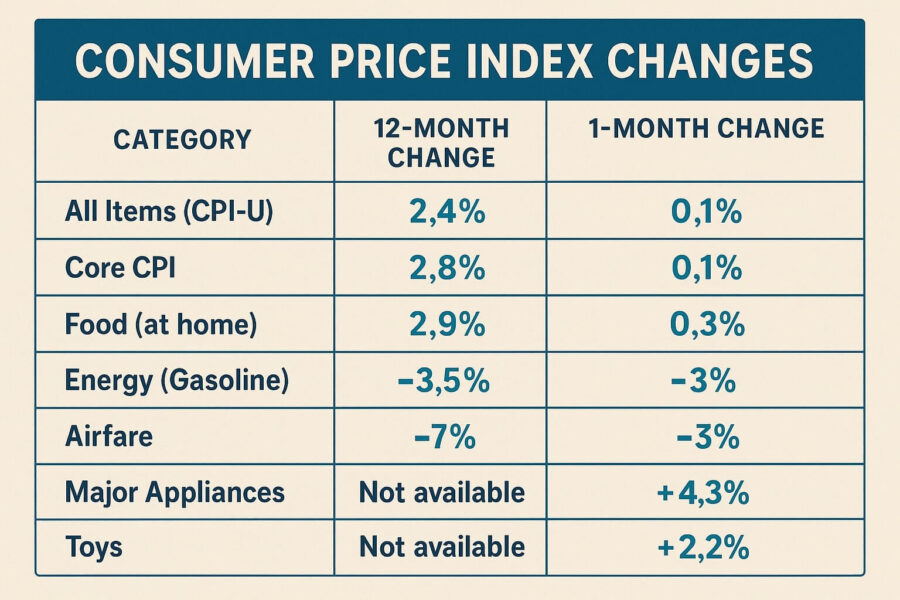
Here’s a breakdown of key categories, as per the U.S. Bureau of Labor Statistics:
Let’s look closer at a few of those.
Food Prices Are Creeping Back Up

After a brief dip in April, grocery prices rose by 0.3% in May. That’s not a huge monthly increase, but over the course of a year, food-at-home inflation stands at 2.9%.
Factors like transportation costs, extreme weather, and labor shortages in agriculture are all playing a part here.
For families already watching their grocery spending, this uptick makes a noticeable difference—especially for staples like bread, dairy, and produce.
Energy Costs Are Offering Relief
Gasoline prices fell 3% in May and are down 12% year-over-year. That’s been one of the most visible and helpful breaks for consumers.
If you’re filling up regularly, you’re probably feeling a little less squeeze at the pump than in 2022 or 2023.
Lower energy prices are also helping reduce delivery costs and manufacturing expenses, which indirectly helps keep other goods from climbing too fast.
Airfare Has Dropped
Air travel is actually getting cheaper, for now. Airfare fell 7% compared to last year, and dropped another 3% just from April to May. Lower demand, improved efficiency, and stronger supply chains are playing a role.
If you’ve been holding off on booking that summer trip, this might be your moment.
Appliance Prices Are Up, and Tariffs May Be Why
One of the biggest monthly spikes came from major appliances, up 4.3% in May alone. Toys weren’t far behind, jumping 2.2%. These increases are likely tied to new trade tariffs, which are adding cost pressure to imported goods.
And that brings us to one of the big wildcards in the inflation story right now: trade policy.
Tariffs Are Making a Comeback
Since early 2025, the U.S. has rolled out a series of new tariffs. The headline numbers are:
- 10% general tariff on many imported goods
- 25% tariff on imported cars and auto parts
- 50% on steel and aluminum
- Additional tariffs specifically targeting Chinese imports
The effective tariff rate has risen from 2% at the end of 2024 to 6% by April 2025. That’s a steep increase, and it’s already starting to ripple through prices. According to Wired, these tariffs could add up to between $3,800 and $4,000 in extra costs for the average household by the end of 2025.
If tariffs remain or increase, economists warn inflation could climb toward 4% by year-end. For now, the impact is limited to specific categories, but there’s potential for broader price hikes as costs move through the supply chain.
Supply Chains Are Recovering, Mostly
One bright spot: global supply chains are in better shape than they were a year or two ago. Electronics, vehicles, and other goods that were once hard to find or delayed for months are now reaching shelves more reliably.
That means fewer price spikes from scarcity, and it’s helping keep inflation down in some areas.
The Labor Market Is Easing Off

Wage growth has slowed, and unemployment has ticked up slightly in recent months. That means businesses are under less pressure to hike prices just to cover labor costs.
A softer job market doesn’t feel great for workers, but it can help contain inflation. If companies aren’t constantly raising wages, they’re less likely to pass along those costs in the form of higher prices.
Base Effects
There’s one more factor propping up the inflation rate that might fade soon: base effects.
Prices were unusually flat in May 2024, so this year’s annual comparison makes the increase look a little steeper than it might really be.
As we move into the second half of 2025, those comparisons should smooth out, potentially making the inflation rate look a bit more stable or even lower—unless new price pressures kick in.
Inflation Isn’t Uniform – Regional Differences Matter
Not every city or region experiences inflation the same way. According to statistics, San Diego clocked in with the highest regional inflation in May at 3.8%—a full 1.4% above the national average.
Why? High housing costs are a big reason. Local supply and demand, housing availability, wages, and even weather events can cause inflation to spike in one area and stay tame in another.
For policymakers and residents alike, these local swings can matter just as much—or more—than the national number.
What It All Means for Everyday Life

So what does 2.4% inflation actually look like in practice?
For Consumers
- Groceries: Still edging higher, so shopping smart matters more than ever. Bulk purchases, store brands, and meal planning can help stretch dollars.
- Appliances: If you’ve been thinking about upgrading, waiting a bit might pay off—tariff-driven increases could ease if policies shift.
- Gas & Travel: Lower fuel prices and airfare are giving consumers a bit of breathing room.
For Policymakers
- The Federal Reserve is keeping a close eye on inflation as it debates future interest rate moves. At 2.4%, there’s no immediate urgency to raise rates—but if tariffs drive inflation higher, that could change.
- Monetary policy decisions over the next few months may hinge on whether trade-related inflation accelerates.
For the Economy
- A stable inflation rate supports steady consumer spending, which is good for growth.
- But if price pressures build, it could eat into real wages and slow down economic momentum.
What Might Happen Next?

The second half of 2025 could go a few different ways. Here are the big factors to watch:
What Could Push Inflation Higher
- Tariffs: If more duties are added—or if other countries respond with tariffs of their own—prices could rise across multiple categories.
- Global Tensions: Trade disruptions, conflicts, or new pandemics could strain supply chains again.
- Climate Events: Droughts, floods, or heatwaves can drive up food and energy costs.
What Could Keep It Stable, or Even Lower It
View this post on Instagram
- Housing: Rent and mortgage costs are no longer surging like they were. That’s helping keep a major CPI component in check.
- Labor Market: With wage growth slowing, inflationary pressure from pay raises is softening.
- Better Supply Chains: More consistent availability of goods should help keep prices from spiking unpredictably.
The next CPI release—due July 15, 2025—will show where we stand after June. That’ll give a clearer picture of whether inflation is settling in or heating back up.
Methodology
- We used official government data from the BLS (CPI, core CPI) and the Federal Reserve (PCE) to report accurate inflation figures for May 2025.
- We broke down inflation by category using detailed sub-indexes (e.g., food, gas, airfare) to show how different sectors are affected.
- We incorporated policy context, including recent tariff hikes and their estimated household impact, using sources like Wired and federal announcements.
- We highlighted regional variation, identifying San Diego as the highest-inflation metro area and explaining local drivers like housing.
- We analyzed contributing factors, such as labor market trends, supply chain recovery, and base effects influencing year-over-year comparisons.
- We provided forward-looking insights on what could push inflation higher or lower in the second half of 2025.
Final Thoughts
Inflation in the U.S. is in a cautiously stable spot. At 2.4%, it’s close to the Fed’s 2% goal, and a long way from the pandemic-era spikes that rattled budgets just a few years ago. But rising tariffs, shifting global dynamics, and uncertain energy prices mean nothing is locked in.
For now, consumers are feeling both ups and downs: relief at the pump and on airline bookings, but pressure on groceries and household goods. And policymakers are walking a careful line, trying to keep inflation from rising while still supporting growth.
We’ll know more soon—but for June 2025, it’s fair to say: inflation isn’t gone, but it’s not out of control either.