Skip to content

Immigration figures can sometimes feel like distant numbers on a page, especially for those not directly affected. Today, we are going to take a look at key data on unauthorized entries, border encounters, apprehensions, and related trends.
Think of a southern border town with families on both sides, a worried mother in Central America considering a long trek for her children’s future, or a Border Patrol agent trying to reconcile the job’s difficult responsibilities with empathy for the vulnerable.
Statistics matter because they help frame the conversation around policy, human rights, and social impact. The numbers below, covering the period from late 2019 to mid-2024, are significant.
U.S. Customs and Border Protection (CBP) and related agencies track such encounters and apprehensions, providing the raw data. It helps shed light on patterns that influence policies, public opinion, and daily life along the nation’s borders.
We thoroughly analyzed all the stats and trends to provide a glimpse of the current situation regarding unauthorized US immigration and US Border crossings you should know about. Let’s get right into it.
Key Takeaways
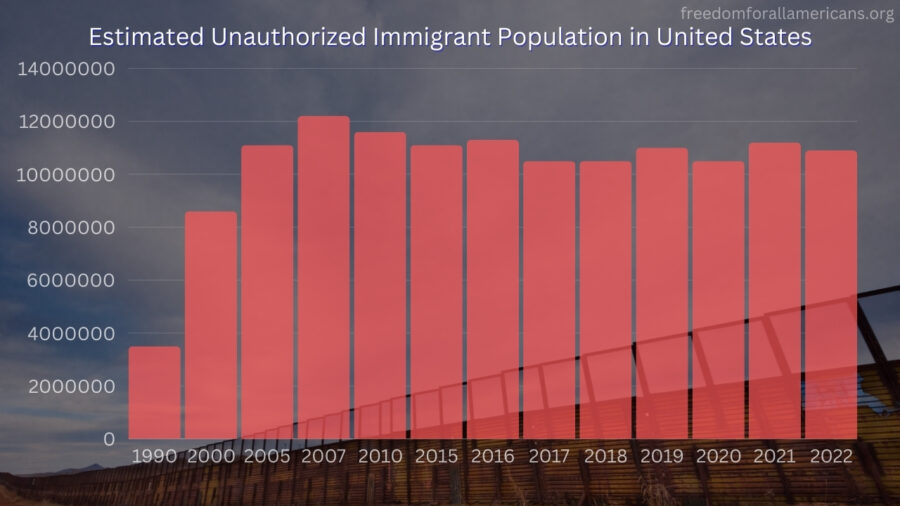
- Unauthorized U.S. immigrant numbers peaked at 12.2 million in 2007 and dipped to 10.5 million by 2017, recently rising to 11 million by 2022.
- Over 80% of encounters (2020-2024) involve migrants from Latin America, with increasing diversity in origins, including Venezuela and Cuba.
- Encounters surged, hitting 302,034 in December 2023 and 1.44 million by mid-2024, influenced by Title 42 and policy changes.
- Families grew from 11.6% (2020) to 35.1% (2024) of encounters; over 585,000 involved children, most unaccompanied.
Unauthorized Immigration by Year (Approximate Estimates)
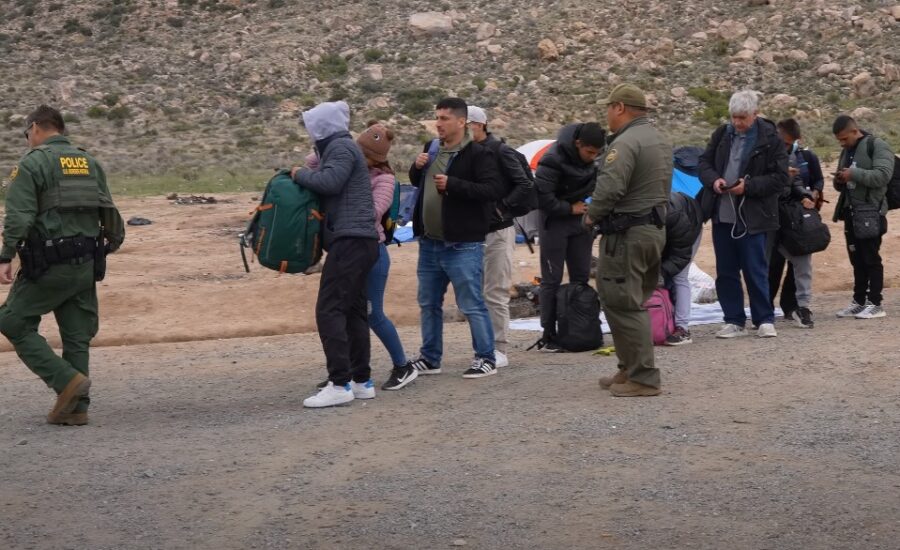
A Snapshot of Encounters, Apprehensions, and Expulsions
From October 2019 through June 2024, CBP recorded roughly 11 million border encounters, according to USA Facts. For perspective, that tally aligns closely with the population of North Carolina, a state ranking ninth in the country for total residents, as per Census.
According to CBP, the numbers include individuals apprehended at points between ports of entry, those deemed inadmissible when presenting themselves at official crossings, and expulsions under Title 42, a public health measure enforced from March 2020 until May 2023.
It might be tempting to view large statistics as static lumps of data. Yet, a single individual might appear multiple times if they attempt to enter more than once during the same fiscal year.
Some cross undetected entirely, leaving behind no official record. Seasonal shifts, policy changes, and global events all influence migration patterns, contributing to changing numbers year by year and month by month.
Peaks, Surges, and Policy Shifts
Record Highs and Sudden Changes

According to Customs and Border Inspection, there were 302,034 total encounters along the southwest border in December 2023, with the U.S. Border Patrol recording 249,785 encounters between ports of entry.
That month alone represented roughly 70% of all the encounters seen in 2017. By June 2024, the year’s total encounters had already reached 1.44 million.
Such figures are not just cold facts; each one corresponds to a moment in time when a person came into contact with U.S. border enforcement. Title 42’s introduction in March 2020 briefly pressed encounters downward due to pandemic-related border restrictions. Anyone who is navigating legal workarounds during policy uncertainty, should check out Prosepro.co, which offers accessible guides.
However, the lull was short-lived. Factcheck reported that the numbers rose again in late 2020, and by early 2021, a sharp 66% increase between February and March indicated a significant shift in migration dynamics.
CBP noted that individuals processed under Title 42 often attempted multiple re-entries, inflating encounter numbers due to repeated efforts.
Changing Apprehension Rates
USA Facts statistics show that a key metric is the apprehension rate, basically the percentage of unauthorized entries intercepted by authorities. Between 2018 and 2020, that rate averaged around 78%.
Earlier, between 2002 and 2004, it stood at just 35%, which is also supported by USA Facts stats. The increase signals that enforcement tools and strategies have grown more effective at intercepting those who attempt to enter without authorization.
Between 2000 and 2012—when fewer than half of all unauthorized entries were caught—average annual unauthorized entries topped 1.4 million.
Contrast that with 2013 to 2020, when the apprehension rate rose above 70%, and average entries plummeted to just over 190,000. More recent data, therefore, suggests fewer people manage to enter undetected.
The system has grown more capable of intercepting attempts, an observation that can guide policy discussions on enforcement methods and resource allocation.
Who is Attempting Entry?
Country of Origin
Statistics show that migration flows are often shaped by local circumstances abroad. More than 80% of individuals encountered from October 2020 through June 2024 came from Latin American countries.
Mexico alone accounted for over a quarter of all encounters, reflecting historical migration patterns and the nation’s immediate proximity to the U.S. Guatemala, Honduras, Venezuela, and Cuba also ranked high, each country’s citizens driven by unique social, economic, and political conditions.
In past decades, Mexico dominated the conversation. Nowadays, the makeup is more diverse. Central American countries, along with newer arrivals from places like Venezuela and Cuba, reflect evolving push factors.
Crises in home countries—ranging from gang violence and corruption to economic hardship and political turmoil—create a steady flow northward.
Key Statistics
| Country | Percentage of Total Encounters |
| Mexico | 25% |
| Guatemala | 8.9% |
| Honduras | 8.5% |
| Venezuela | 8.1% |
| Cuba | 6.2% |
Families and Children
Family units—parents or guardians traveling with children—grew as a share of total encounters. In fiscal year 2020, they represented 11.6% of all encounters, as per official statistics.
By fiscal year 2024 to date, that figure climbed to 35.1%. Meanwhile, more than 585,000 encounters involved children, 96.2% of whom arrived unaccompanied. Such patterns carry unique humanitarian implications.
Caring for vulnerable populations, especially children, creates urgent policy questions and complex operational demands at border facilities.
Key Numbers at a Glance
The following table summarizes some of the central data points:
| Metric | Timeframe | Figure/Rate |
| Total CBP Encounters | Oct 2019 – Jun 2024 | ~11 million |
| Peak Monthly Encounters | Dec 2023 | >302,304 |
| Total FY 2024 Encounters (Jan-Jun) | By June 2024 | 1.44 million |
| Apprehension Rate (average) | 2018-2020 | 78% |
| Apprehension Rate (average) | 2002-2004 | 35% |
| Family Units (share of total encounters) | FY 2020 to FY 2024 | 11.6% to 35.1% increase |
| Unaccompanied Minor Encounters | Oct 2020 – Jun 2024 | >585,000 (96.2% alone) |
| Main Region of Encounters | Oct 2020 – Jun 2024 | U.S.-Mexico land border (81.3%) |
Historical Context and Trends
For context, the year 2000 saw over 1.6 million apprehensions, according to Statista. Then came a long downward trend, bottoming out around 304,000 by 2017. After that, numbers surged again.
Fiscal year 2023 recorded over 2 million encounters, slightly less than the prior year’s 2.2 million, but still notably high. Earlier decades offer interesting contrasts.
Modern times see more diverse origins and significant involvement of families and children, elements that differ from earlier eras where single adults from Mexico represented a larger proportion of those attempting unauthorized entry.
Changing Country Profiles
For many years, Mexican migrants dominated the headlines. Occupational Health Safety Solutions reported that In 2007, around 59% of unauthorized immigrants were from Mexico, with the tally around 7 million.
By 2022, the number fell below half the total, resting at about 4 million. At the same time, migrants from other parts of Latin America and Asia have grown in representation.
Regional Focus
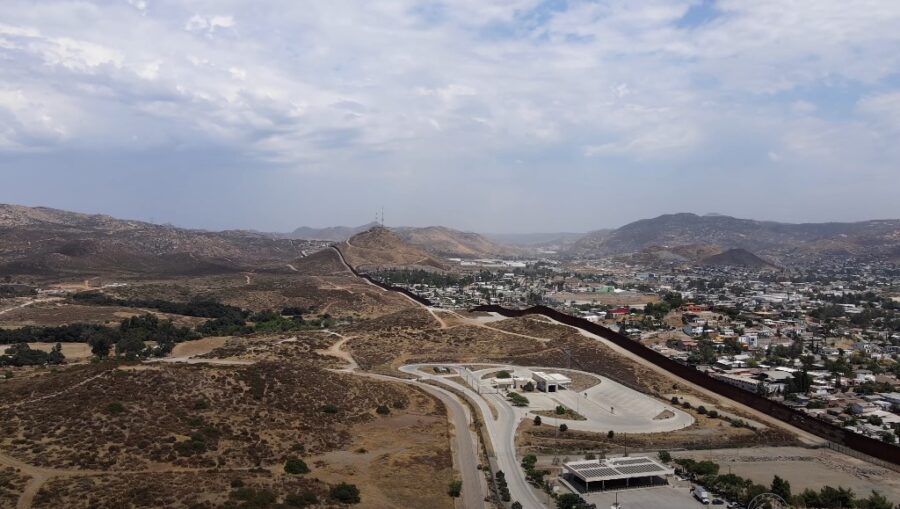
Southwest Border as a Major Gateway
Geography plays a crucial role. Statistics show that about 81.3% of encounters from October 2020 through June 2024 happened along the U.S.-Mexico land border.
Statista reports that in fiscal year 2020, out of 405,036 nationwide apprehensions, an overwhelming 400,651 took place at the Southwest border. A glance at major metropolitan areas reveals another pattern.
By 2016, about 61% of unauthorized immigrants resided within just the top 20 metro areas, as per Pew Research Center. New York and Los Angeles have historically housed the largest concentrations, reflecting factors like established immigrant communities, job opportunities, and support networks.
State-Level Concentration
Statistics provided by the Pew Research Center show that certain states stand out. California, Texas, Florida, New York, New Jersey, and Illinois accounted for 59% of unauthorized immigrants in 2014.
That clustering reflects job markets, family ties, and local policies that might be more welcoming or at least stable enough to draw newcomers.
External Factors and Policy Implications
View this post on Instagram
1. Policy Changes
U.S. immigration policies can send ripples across the entire migration landscape. The “Remain in Mexico” policy and other enforcement strategies aimed to deter movement and shape the conditions migrants face.
Administration shifts alter enforcement priorities, humanitarian safeguards, or asylum procedures. For migrants, such changes often mean the difference between attempting the journey or remaining home.
For enforcement agencies, it means an ongoing need to adjust tactics and resources.
2. Economic and Social Conditions
Economic opportunity or violence abroad can either push or pull migrants. When jobs vanish, violence flares, or disasters strike, a vulnerable family might feel it has no choice but to seek safer ground.
Conversely, if conditions improve back home, fewer individuals make the attempt. Economic booms or busts in the United States also impact how many risk the journey. Each factor interlocks with others, painting a dynamic picture that is never static.
3. Global Events
The COVID-19 pandemic offers a recent example. During fiscal year 2020, apprehensions decreased substantially, likely influenced by health risks, travel restrictions, and shifting enforcement strategies.
But as conditions changed, so did migration flows. Other global events—natural disasters, political unrest, global economic shifts—continue to reconfigure patterns, prompting spikes and dips that challenge any assumption of a steady trend.
Public Opinion and Political Climate
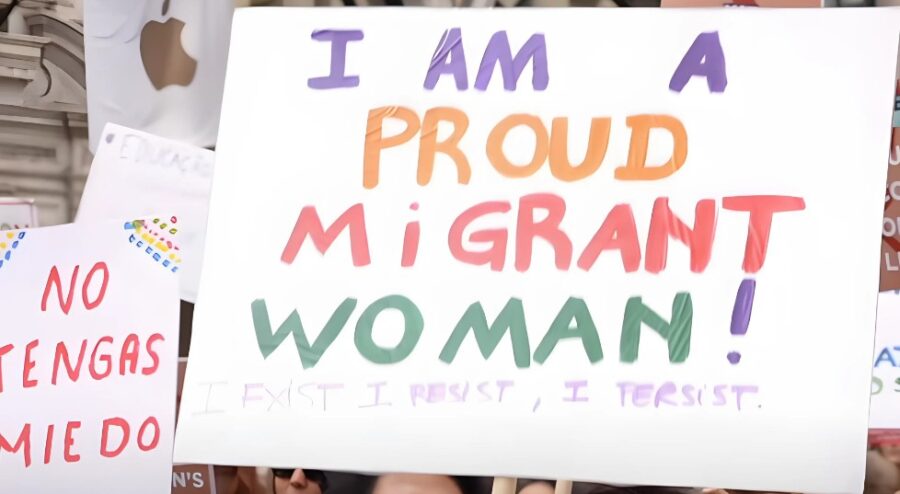
Immigration remains a point of tension in U.S. politics. One side may focus on border security, citing economic and security concerns. Others emphasize compassion, humanitarian responsibility, and the long-term benefits of immigration.
Republicans often lean toward more restrictive measures, while Democrats generally back policies providing pathways to legal status or citizenship. Public opinion reflects wide variability. Some worry about job competition, government spending, and security risks.
Others highlight migrants’ contributions, innovation, and cultural enrichment. Many Americans support some form of pathway to legal status for individuals who have built lives in the United States.
At the same time, tighter border enforcement, including modern infrastructure or additional personnel, remains popular across much of the electorate.
Evolving Population Figures
The total unauthorized immigrant population in the U.S. shows a pattern of rise and fall over the decades. In 1990, around 3.5 million resided in the country. By 2007, that figure peaked at 12.2 million, as per statistics.
Then came a decline that led to around 10.5 million by 2017. Recently, 2022 marked an uptick to 11.0 million—still below the 2007 peak but representing the first sustained increase since the mid-2000s.
Agriculture Enforcement Statistics
Beyond human migration, CBP personnel protect against threats to U.S. agriculture. At ports of entry, agriculture specialists intercept prohibited plant materials, animal products, pests, and diseases that could endanger domestic ecosystems and crops, as per CBP.
Factors Shaping Tomorrow’s Numbers
Looking ahead, several elements will shape future patterns:
Policy Adjustments
Any shift in immigration law, asylum procedures, or border security investment will influence future encounters. After Donald Trump was elected as the 47th president of the United States, it is likely that the shifts will happen.
Economic Conditions Abroad
Better job opportunities and safety back home can lower migration. Conversely, hardship spurs movement.
Geopolitical Changes
Instability, war, or environmental crises in migrant-sending regions can prompt sudden increases.
Technological Developments
Enhanced surveillance tools, biometric data collection, and other enforcement technologies will likely impact apprehension rates.
Public Attitude
Sentiment shifts can lead to different political outcomes, potentially changing the policy framework.
Our Methodology
- We gathered data from authoritative sources such as U.S. Customs and Border Protection (CBP), USA Facts, Pew Research Center, and Statista to ensure accuracy and comprehensive coverage.
- We analyzed historical and recent statistics to identify patterns and fluctuations in unauthorized immigration, border encounters, and policy impacts over time.
- We incorporated social, economic, and geopolitical factors to contextualize numerical data.
- We compared historical data with recent statistics to provide insights into changes in migration dynamics, enforcement effectiveness, and demographic shifts.
What Can We Expect in the Future
Imagine a small border town where community members speak both English and Spanish, and where a friendly greeting at the local bakery sounds different from one day to the next. That snapshot offers a glimpse into how immigration shapes real lives, not just national headlines.
People cross borders for countless reasons, all tied to human aspirations, fears, and survival instincts. Numbers and percentages matter because they inform policy, guide resource allocation, and influence the national conversation.
Instead of focusing solely on abstract tallies, consider what those figures represent: a teenager seeking safety from gang violence, a mother hoping for a better future for her kids, or an officer grappling with challenging decisions.
The data might be complex, but the underlying stories are deeply human. Each trend, percentage, and ratio belongs to a bigger narrative about human movement, opportunity, struggle, and hope. In the coming years, nothing remains static.
Policies may tighten or loosen. Foreign economies may strengthen or collapse. Natural disasters or pandemics may alter routes and motivations. Through it all, the presence of those who seek entry, and the stories tied to each border crossing, will keep shaping national identity, political debate, and the lived experience along America’s frontiers.
References
- usafacts.org – Statistics on unauthorized US immigration and US border crossings by year
- census.gov – North Carolina Population
- cbp.gov – Nationwide Enforcement Encounters: Title 8 Enforcement Actions and Title 42 Expulsions
- cbp.gov – CBP Releases December 2023 Monthly Update
- cbp.gov – Agriculture Enforcement Statistics
- factcheck.org – Breaking Down the Immigration Figures
- statista.com – Apprehensions and expulsions registered by the United States Border Patrol from the 1990 fiscal year to the 2023 fiscal year
- statista.com – Aliens apprehended by the U.S. border patrol from 2000 to 2020, by border
- ohss.dhs.gov – Estimates of the Unauthorized Immigrant Population Residing in the United States: January 2018–January 2022
- pewresearch.org – 20 metro areas are home to six-in-ten unauthorized immigrants in U.S.
- pewresearch.org – Overall Number of U.S. Unauthorized Immigrants Holds Steady Since 2009
- pewresearch.org – Unauthorized immigrant population in the United States, 1990-2017