Skip to content
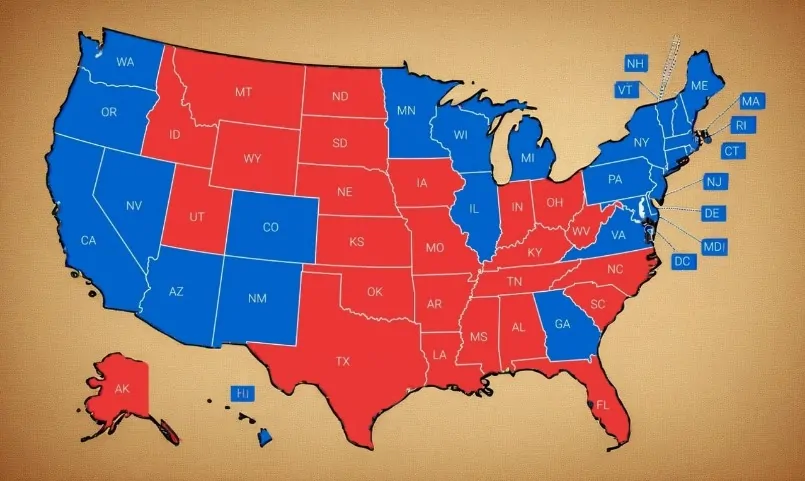

“Red states” and “blue states” still work as political shorthand in 2026. The labels help people picture election-night maps, cultural fault lines, and policy fights that now play out state by state.
But the shorthand also hides what matters most right now: American politics is less about one national left-right spectrum and more about 50 different governing models that shape daily life in very specific ways.
Abortion access, health coverage, voting rules, energy development, tax structure, labor markets, and migration patterns all vary sharply across state lines, sometimes even inside states.
A clean way to read America in early 2026 is to treat “red” and “blue” as starting points, then add a few concrete layers: presidential voting, state government control, and policy outcomes.
The Map Lies, the Rules Don’t
- The 2024 presidential map still looks red-blue, but state government control in 2026 is what actually drives day-to-day rules.
- “Red” and “blue” do not reliably predict policy anymore, especially on Medicaid expansion and other core programs.
- Abortion access is one of the sharpest state-by-state divides, with cross-border pressure reshaping access states.
- Jobs and migration patterns vary widely by state, often tracking industry mix and housing more than party labels.
What Red and Blue Mean in 2026

The label most people mean: presidential vote. The most common definition is simple – which party carried the state in the most recent presidential election.
The Federal Election Commission’s official 2024 presidential general election results show Donald J. Trump won 312 electoral votes and Kamala D. Harris won 226.
That result matters because presidential outcomes still shape how many voters talk about a state’s political identity, especially online and in national media.
Who Runs State Government?
State policy is usually driven by:
- the governor’s party
- party control of both chambers of the state legislature
- whether one party controls both legislative chambers and the governorship (a trifecta)
The National Conference of State Legislatures (NCSL) tracks state partisan control. In its January 27, 2026 snapshot, NCSL reports 23 Republican trifectas, 16 Democratic trifectas, and 10 divided states (Nebraska’s nonpartisan unicameral system gets separate treatment).
That breakdown helps explain a core reality of 2026: plenty of states vote one way for president and govern another way, or govern in split form that forces compromise, stalemate, or periodic deal-making.
A Practical Definition
A useful working approach looks like the table below.
2024-to-2026 Snapshot
Let’s take a look at the presidential map by electoral votes. The simplest national picture from the official FEC summary:
| Candidate | Party | Electoral votes (2024) |
| Donald J. Trump | Republican | 312 |
| Kamala D. Harris | Democratic | 226 |
A small but important reminder: Maine and Nebraska can split electoral votes, and the FEC table shows split allocations for both.
State Government Control Entering 2026
NCSL’s January 27, 2026 breakdown is one of the cleanest single-page snapshots available for the full country. It includes governor party, legislative chamber control, and overall “state control.”
“Red” and “Blue” No Longer Predict One Consistent Policy Package
A decade ago, you could often guess a state’s policy posture from its partisan label. In 2026, guessing gets riskier, because policy coalitions have splintered across issues.
Two examples show why.
Health Coverage: Medicaid Expansion Has Moved Beyond a Pure Partisan Map
The Kaiser Family Foundation’s tracking shows 41 states (including DC) have adopted Medicaid expansion, and 10 states have not as of February 27, 2026.
Medicaid expansion used to align closely with partisan identity. Now, the map is more complicated because:
- ballot initiatives changed outcomes in multiple states over time
- hospital systems, rural access pressures, and budget math shifted politics
- state leaders sometimes protect expansion even while opposing other federal programs
Abortion Policy: State Differences Are Sharper Than Almost Any Other Issue
Abortion policy is a place where state lines matter immediately. Guttmacher’s state policy map groups states into categories based on abortion policies in effect.
KFF’s dashboard summarizes the national picture, including counts for bans and gestational limits. As of January 6, 2026, KFF lists 13 states where abortion is banned, plus additional groups with limits such as 6-to-12-week ranges.
Takeaway: Blue state often correlates with broader abortion access, yet even among Democratic-led states, access can depend on clinic capacity, geography, and cross-state demand patterns. Policy category tells only part of the story.
“Purple” States Are Usually Governance Puzzles

A lot of national attention stays locked on a familiar set of swing states. In 2026, the more revealing question is not “Who won last time?” but “How does the state function when power is split?”
NCSL’s 2026 snapshot shows several states with divided control, where one party controls the legislature and the other holds the governorship, or where chambers are split.
What Divided Control Produces in Practice
Divided control tends to push states into one of three modes:
- Budget-first governing: big fights happen, but budgets pass because shutdown threats force agreements.
- Issue-by-issue bargaining: a state might pass business incentives, block social policy changes, then cooperate on infrastructure.
- Stalemate with executive action: governors lean on agencies, rulemaking, or veto threats, while legislatures use investigations and budget leverage.
Examples visible in the NCSL table include states listed as “Divided” in overall control, such as Arizona, Kansas, Kentucky, Michigan, Minnesota, Nevada, Pennsylvania, Vermont, Wisconsin, and others.
Economic Life Differs by State More Than Most Political Debates Admit
National politics often turns state comparisons into cultural stereotypes. Real economic differences show up in labor markets, cost structures, and population movement.
What’s Happening With Labor Markets? Unemployment Varies Widely Entering 2026
The Bureau of Labor Statistics’ state unemployment ranking table (seasonally adjusted) shows large gaps in the most recent posted month, December 2025, updated January 27, 2026.
A small sample from the same table:
| Category | States | Unemployment rate |
| Lowest (tied) | Hawaii, South Dakota | 2.2% |
| Among lowest | North Dakota, Vermont | 2.6% |
| Highest state | California | 5.5% |
| Highest overall in table | District of Columbia | 6.7% |
Political identity does not map neatly onto that ranking. Some heavily Republican states sit in low unemployment ranges, and some heavily Democratic states do too.
Sector mix matters more: tourism, tech cycles, energy extraction, government employment, and housing costs all reshape labor markets.
Migration: the 2024 ACS flows add new detail to the “moving to red states” story
The U.S. Census Bureau released 2024 state-to-state migration flows based on the 2024 American Community Survey 1-year estimates in January 2026.
A useful caution about migration narratives in 2026:
- Net flows can shift fast year to year
- Domestic moves and international moves are different forces
- Remote work changes the “why” behind moves, not only the “where”
Policy Divides That Most Clearly Separate State Models in 2026

A clean way to read modern red vs blue is to track a handful of policy areas where state control produces fast, visible changes.
1. Healthcare Access and Safety Net Design
Medicaid expansion remains one of the most measurable state choices because it changes eligibility for low-income adults up to 138% of the federal poverty level, with enhanced federal matching for the expansion population. KFF’s February 27, 2026, tracking captures adoption status by state.
Common patterns tied to expansion status:
- Rural hospital stability debates often intensify in non-expansion states
- Uncompensated care burdens can rise where coverage gaps persist
- Ballot-driven expansions can create cross-party political detente in certain places
2. Reproductive Rights and Cross-Border Effects
KFF’s abortion dashboard and Guttmacher’s policy categories show how fragmented the U.S. landscape is post-Dobbs, with bans in a block of states and protections in others.
Cross-border effects matter in 2026:
- Patients travel from ban states to access states
- Clinic systems in access states face demand pressure
- Telehealth and medication abortion access become major operational and legal battlegrounds
Policy maps are necessary, then residents still have to ask a second question: where are clinics, how far is travel, and how stable is access over time.
3. Taxes: Income Tax Structure Is a Real Red-Blue Divider, With Exceptions
State tax structures are a place where the partisan pattern often holds more consistently, though local property taxes and sales taxes complicate the picture.
Tax Foundation’s January 1, 2026 compilation of state individual income tax rates and brackets gives a single-page reference for top marginal rates as of that date.
A practical interpretation:
- Many Republican-led states favor lower income taxes or no broad wage income tax
- Many Democratic-led states rely more heavily on progressive income tax systems
- The lived burden still depends on deductions, credits, sales taxes, property taxes, and housing costs
Use that kind of table as a starting point, then verify the full tax mix before drawing conclusions.
4. Energy: Production Realities Cut Across Ideology
Energy policy is often presented as culture war material. The infrastructure underneath it is more concrete.
The U.S. Energy Information Administration publishes state energy profiles and analysis pages that cover generation mix, production, consumption, and emissions measures.
EIA also reported record renewable energy production in the U.S. in 2024, including record output from wind and solar.
Red vs blue in energy is less about slogans and more about:
- where resources exist (wind corridors, solar potential, hydro capacity, natural gas basins)
- transmission buildout, permitting, and interconnection queues
- industrial demand growth, including data centers and manufacturing
A red state can lead in wind development. A blue state can rely heavily on natural gas. The grid forces pragmatism.
Why the Label Still Matters, Even Though It Misleads
Red and blue labels keep mattering because they affect:
- Where campaigns invest money and staff
- How the national media frames local events
- How businesses assess regulatory risk
- How families judge school policy, healthcare access, and cost of living across state lines
But the label misleads when it becomes a personality test for millions of residents who live in politically mixed metro areas, suburbs, and rural regions.
A more accurate way to talk about states in 2026 is to separate identity from governance:
- A state can vote Republican for president and still expand Medicaid.
- A state can vote Democratic for president and still have pockets of deeply conservative local government.
- A state can be “purple” in elections and still run under a stable trifecta that pushes policy in one direction.
FAQs
Methodology
- I started by defining what red state and blue state actually mean in 2026, then separated presidential voting, state government control, and real policy outcomes so I would not rely on lazy political shorthand.
- I grounded the election section in official 2024 presidential results from the Federal Election Commission, because that is the cleanest baseline for how states are commonly labeled in national coverage.
- I used the National Conference of State Legislatures to verify who actually controls state government in 2026, including governors, legislative chambers, trifectas, and divided governments.
- I treated partisan identity and governing reality as separate questions, because a state’s label does not always match the laws residents live under.
- I relied on current, issue-specific trackers for major policy areas, especially Medicaid expansion, abortion policy, and tax structure, so each claim rested on a source built for that subject.
- I used Kaiser Family Foundation and Guttmacher data to show where healthcare and reproductive policy differences are measurable, immediate, and state-specific.
- I included labor market data from the Bureau of Labor Statistics to avoid turning economic differences into cultural stereotypes or partisan assumptions.
- I brought in Census migration data to test common narratives about people “moving to red states” or “leaving blue states,” instead of repeating political talking points.
- I used Energy Information Administration data to show that energy policy is shaped by infrastructure, resource geography, and production realities, not just ideology.
- I avoided treating any single map as the whole story. I built the article in layers so readers could see how voting patterns, governing control, and policy outcomes overlap, or fail to overlap.
- I chose nonpartisan or primary-source institutions wherever possible, because credibility matters more than speed on a topic that is often oversimplified.
- I added a practical framework and FAQ section so readers could verify key concepts for themselves, including trifectas, split electoral votes, PVI, and state preemption.
- I kept the argument evidence-first throughout, with the goal of helping readers compare states based on documented governance and policy, not media branding.
Summary
America’s red-blue map in 2026 still reflects the presidential divide visible in the FEC’s official 2024 results.
The deeper story sits underneath: state control patterns tracked by NCSL, plus policy regimes in healthcare, abortion, taxes, labor markets, migration, and energy.
Treat “red” and “blue” as an entry point, then verify governance and policy outcomes before treating any state as predictable.