Skip to content

Ohio’s job scene in 2024 is throwing up some pretty interesting trends that both job hunters and policymakers should keep an eye on.
Right now, the unemployment rate in Ohio is sitting at 4.20%. It’s a bit higher than last month and definitely up from last year.
These numbers show some important changes happening in the job market.
Ohio’s civilian labor force has been inching upwards, growing from 5,793 in December 2023 to 5,808 by May 2024.
This means more Ohioans are jumping into the workforce, even though unemployment is creeping up.
For anyone keeping tabs on Ohio’s economy, these stats are a big deal. They highlight key shifts in unemployment and workforce participation.
1. Current Unemployment Rate
As of May 2024, Ohio’s unemployment rate increased to 4.2% from 4.0% in April 2024 according to Ohio gov. This rise points to recent economic challenges impacting the state. Despite the increase, the overall number of jobs grew, with nonagricultural wage and salary employment rising by 21,200 positions in the same month, reaching 5,662,600 jobs.
Ohio saw 6,336 initial unemployment claims filed for the week of May 26 – June 1, 2024 as per same gov source. This weekly data reflects ongoing adjustments in the labor market. Important stakeholders, including the Ohio Department of Job and Family Services, continue monitoring these trends to provide necessary support.
Comparing historical data highlights that the current 4.2% rate is an increase from 3.3% in May 2023. The long-term average is 6.49%, indicating the current rate remains below historical highs.
Recent figures juxtaposed against April 2024 provide insight into short-term fluctuations. April saw a lower rate of 4.0%, despite broader year-over-year trends showing an overall upward trajectory.
2. Unemployment by Age Group
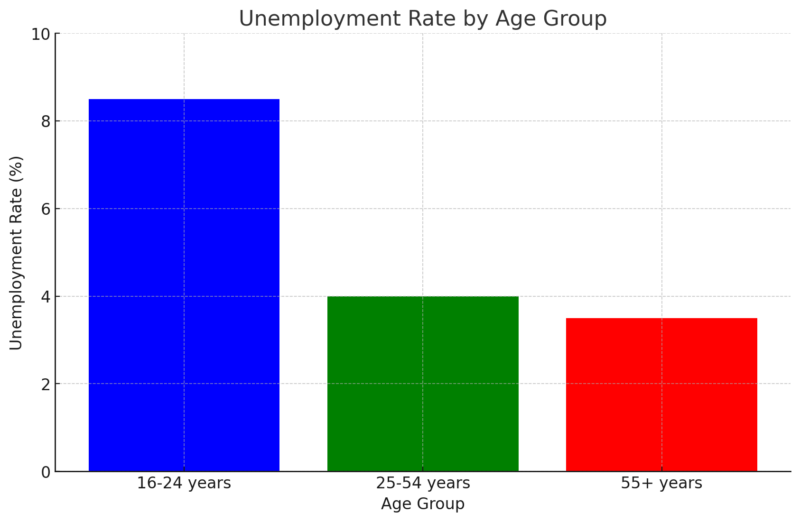
Unemployment in Ohio varies notably by age. Young adults (ages 16-24) face the highest unemployment rates, reflecting challenges like limited work experience and high educational commitments. In contrast, adults aged 25-54 experience lower rates, benefiting from more stable career positions.
For senior workers (ages 55+), unemployment rates are relatively low but can be impacted by factors such as industry-specific downturns and age discrimination.
3. Unemployment by Gender
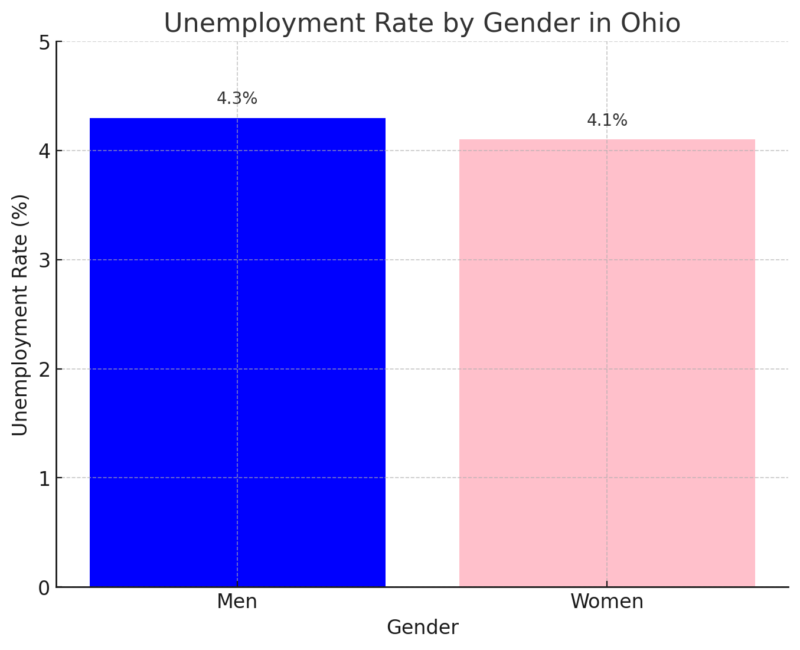
Examining unemployment by gender in Ohio reveals distinct trends. As of 2024, men have an unemployment rate of approximately 4.3%, influenced by declines in traditionally male-dominated sectors such as manufacturing.
On the other hand, women experience a slightly lower rate of 4.1%, which can be linked to increases in employment within sectors like healthcare and education. Economic shifts and societal norms contribute to these gender disparities in employment.
4. Unemployment by Race and Ethnicity
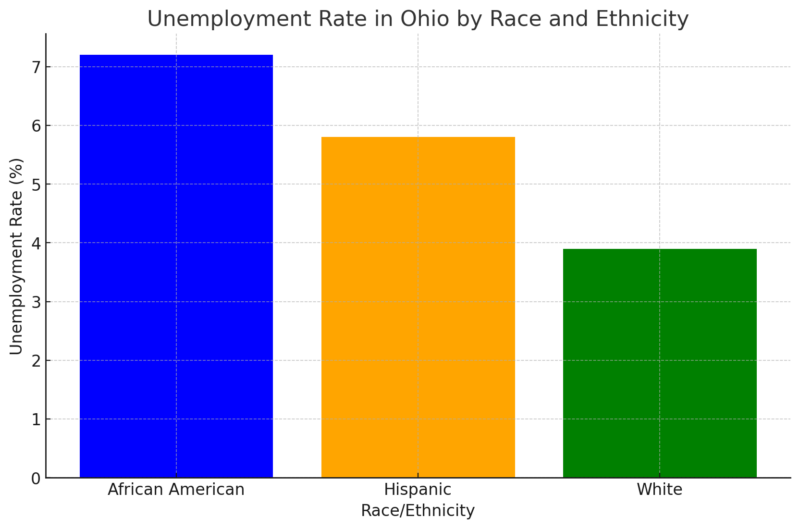
Racial and ethnic disparities are significant in Ohio’s unemployment landscape. African Americans face an unemployment rate of 7.2%, considerably higher than the state average, due to factors like systemic inequalities and concentration in vulnerable job sectors according to Communitysolutions.com.
Hispanic workers encounter a rate of 5.8%, reflecting both similar challenges and growth in industries such as construction. In contrast, White workers have the lowest unemployment rate at 3.9%, indicating more consistent access to stable employment opportunities.
5. By Region
Unemployment rates in Ohio differ across its various regions. For instance, metropolitan areas such as Akron have more detailed economic activity reports and typically exhibit lower unemployment rates compared to rural areas. Toledo, Columbus, and Cincinnati also provide extensive employment data reflecting their larger workforce and diverse economies.
Northeastern Ohio, encompassing places like Canton-Massillon, tends to have higher unemployment rates. Southern and southeastern regions, often more industrial or less densely populated, sometimes experience more pronounced economic challenges. This regional disparity highlights the need for tailored economic policies and interventions.
6. Urban vs. Rural Areas

Urban areas in Ohio, such as Cleveland and Columbus, generally benefit from more robust job markets. These cities often have more diversified economies and better access to education and training programs. For example, employment data shows significant job growth in urban centers, with nonagricultural wage and salary employment increasing by 21,200 jobs from April to May 2024.
Interestingly, while discussing employment trends, it’s noteworthy that the minimum wage in Florida is set to increase in 2024, which could impact labor markets in various regions.
In contrast, rural areas in Ohio experience higher unemployment rates. The reliance on a limited number of industries, often agriculture or manufacturing, makes these regions more vulnerable to economic shifts. Unemployment rates in these areas can reach above 6.0% according to the Ohio PDF map, underscoring the disparity between urban and rural economic conditions.
7. Effects on State GDP
Unemployment directly affects Ohio’s Gross Domestic Product (GDP) by reducing the overall productivity. High levels of joblessness result in fewer people participating in the workforce, leading to lower industrial output and services. This contraction in economic activity translates to less consumer spending, impacting retail and other sectors.
Moreover, businesses might defer expansion plans due to a less favorable economic environment, further stagnating growth. The labor market’s instability often leads to reduced innovation and decreased competitiveness on a national scale.
According to the Bureau of Labor Statistics, Ohio has a lower unemployment rate than the national average. This relatively low rate helps mitigate adverse effects, but pockets of higher unemployment persist, dragging down the economic output in those areas.
8. Impact on Government Budget
Unemployment significantly impacts Ohio’s government budget. Higher unemployment rates lead to increased demands for social services, such as unemployment benefits and public assistance programs, straining state resources. This increased spending on social safety nets often means less funding available for other critical areas like education, infrastructure, and public safety.
At the same time, reduced employment translates to lower tax revenues. Fewer employed individuals mean less income tax collected, and decreased business activity results in lower corporate tax revenues. Consequently, balancing the budget becomes more challenging, requiring either spending cuts or finding alternative revenue streams.
Similarly, New Jersey has faced its own set of challenges with rising unemployment in 2024, further highlighting the widespread impact of joblessness on state economies.
The higher costs and reduced revenues necessitate careful fiscal planning to maintain essential services without excessively burdening residents. Programs aimed at job creation and economic revitalization become more critical in mitigating these adverse budgetary effects.
The Buckeye Institute reports that Ohio’s unemployment rate has been steady, which is promising for maintaining balanced fiscal policies despite these challenges. Nevertheless, continued vigilance is required to ensure economic stability and growth.
9. State Programs and Incentives
Ohio has rolled out a range of state-level programs to combat unemployment. The OhioMeansJobs Centers provide job training, resume workshops, and placement assistance to help job seekers re-enter the workforce.
Moreover, the Higher Education Workforce Initiative collaborates with universities and community colleges to align educational programs with market demands, ensuring graduates possess relevant skills.
Tax incentives and grants have been offered to businesses under the Job Creation Tax Credit and the Ohio Business Development Grant programs. These initiatives encourage companies to expand and hire locally. The state’s investment in the TechCred program is tailored to help businesses upskill their workforce, facilitating adaptations to rapid technological advancements.
10. Federal Assistance and its Effectiveness
Federal assistance has played a pivotal role in Ohio’s employment recovery. The extension of unemployment benefits and emergency assistance throughout 2024 helped many families stay afloat during periods of joblessness. As per the U.S. Bureau of Labor Statistics, the consistent funding under the Pandemic Emergency Unemployment Compensation (PEUC) allowed workers to receive extended benefits.
The Paycheck Protection Program (PPP) enabled small businesses to retain staff by covering payroll expenses. Analysis of the Current Employment Statistics indicates that sectors like health care, government, and hospitality saw continued growth due to these federal supports, highlighting their effectiveness.