

Housing costs remain one of the clearest signals of how uneven American life feels in 2026. In a small group of metro areas, rent, mortgage payments, groceries, transportation, and routine services sit so far above the national norm that even a strong paycheck can disappear fast.
Here are the 10 places where living in the United States costs the most right now.
Quick Ranking Table
How We Ranked These Cities
To identify the most expensive cities in the U.S. in 2026, we relied on the C2ER Cost of Living Index, one of the most widely cited benchmarks for comparing living costs across urban areas.
C2ER’s index measures 61 different items across six core spending categories:
- Housing
- Utilities
- Groceries
- Transportation
- Health care
- Miscellaneous goods and services
That broader approach matters because living costs are shaped by far more than rent or home prices alone. A city may have expensive housing, for example, but the overall cost picture also depends on what residents pay for food, commuting, medical care, and everyday essentials.
According to C2ER, the index is designed primarily around professional and managerial households, which means it works best as a comparative tool for typical middle- to upper-income consumer spending patterns rather than as a precise measure for every household type.
For the final ranking, we used Kiplinger’s analysis of the latest C2ER data to determine which urban areas ranked highest overall. One important note: the ranking includes a mix of cities, counties, and New York City boroughs.
That is why Manhattan, Brooklyn, and Queens appear as separate entries rather than being grouped into one New York City figure.
Because of that structure, the list should be read as a comparison of urban areas as reported in the source data, not strictly as a city-only ranking.
1. Manhattan, New York – The Most Expensive City to Live In in the United States

Manhattan still sits in a category of its own. Kiplinger, using C2ER data, puts its cost of living 132.0% above the national average, far ahead of every other place on the list. C2ER’s figures are especially blunt on housing: the average home price in Manhattan is about $2.95 million, and the average apartment rent reaches $5,735 a month.
Health care, entertainment, and routine personal services also carry a serious premium. A movie ticket and a yoga class cost far more than what most Americans pay, which says a lot about how expensive everyday life can feel once you move beyond rent alone.
Part of Manhattan’s pricing power comes from land scarcity and relentless demand. Finance, media, law, tech, and high-end professional services still pull in workers who need to be close to major employers and networks.
Add global wealth, luxury demand, and one of the densest urban environments in the country, and price relief becomes hard to find. Plenty of U.S. cities are expensive. Manhattan remains the benchmark that makes all the others look merely difficult.
2. Honolulu, Hawaii
Honolulu ranks second, with a cost of living 82.1% above the U.S. average. Geography does a lot of the explaining here. Kiplinger notes that goods shipped to Hawaii arrive largely by boat or plane, which pushes up the price of groceries, transportation, and household essentials. Utilities stand out even more sharply.
In C2ER’s comparison, Honolulu had the highest utility costs of any surveyed urban area, at 94.4% above the mainland norm.
Housing remains brutal too, with C2ER putting average home prices near $1.71 million, while Zillow’s February 2026 figure for average home value in Honolulu was $758,507.
Honolulu shows how an appealing place can become financially punishing for ordinary residents. Paradise has a labor market, rent market, and grocery bill like anywhere else, but all of them are shaped by isolation and constrained land supply.
A family earning a solid income can still feel boxed in by housing, energy bills, and the price of basic shopping trips. In 2026, no mainland city can replicate that exact mix.
3. San Jose, California
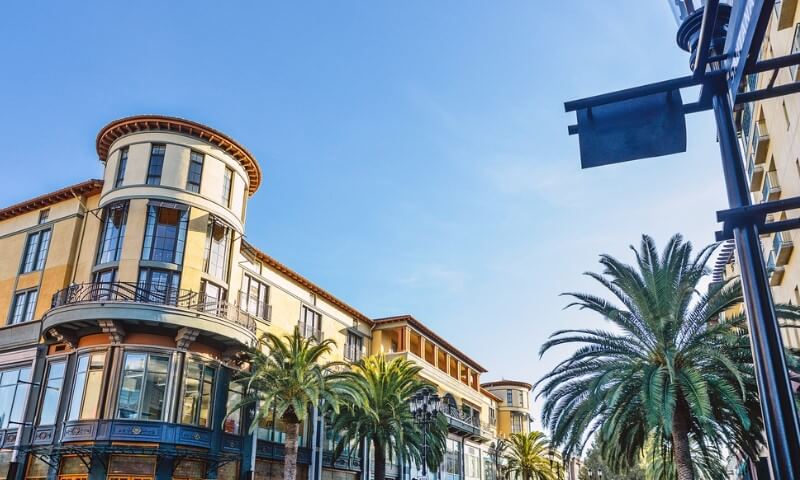
San Jose comes in third at 81.1% above the national average, which tells you a lot about what Silicon Valley still does to local prices. Kiplinger says housing costs run 232% above the U.S. average there.
The mean home price in its C2ER profile is $1,393,400, and Zillow’s February 2026 average home value is even a touch higher at $1,435,993. Even with that figure down 2.7% from a year earlier, San Jose remains one of the least forgiving housing markets in America.
San Jose also has a salary story that looks different from places like Los Angeles or Brooklyn. Median household income is very high, which helps explain why the market can sustain such prices.
Even so, high pay does not make the city affordable; it only raises the threshold for entry. A cooling market in San Jose still means million-dollar homes, steep utility costs, and daily living expenses that chew through income fast.
4. Orange County, California
Orange County ranks fourth, at 61.7% above the national average. C2ER data cited by Kiplinger shows housing in the county costs 173.3% more than what the typical American pays, and the average home price is about $1.645 million.
Zillow’s February 2026 county average home value was $1,169,743, with average rent at $3,137. Those numbers help explain why the county keeps landing on expensive-city lists even when some buyers think of it as a suburban alternative to Los Angeles.
Orange County is a good example of how affluence can spread housing pressure across an entire region rather than one single downtown core.
Newport Beach, Irvine, coastal enclaves, strong schools, and a large professional class all feed pricing power. A buyer might find more space than in central Los Angeles, but rarely at anything close to a bargain.
In 2026, Orange County remains expensive by almost every measure that matters to a household budget.
5. San Francisco, California
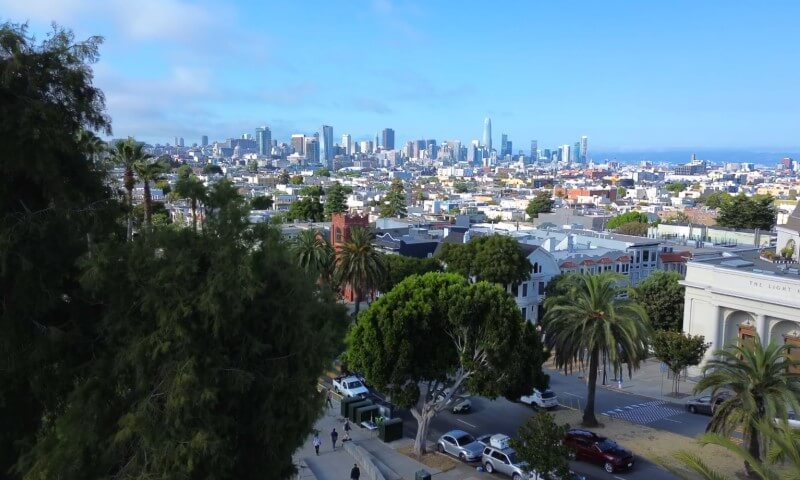
San Francisco sits fifth, with living costs 60.1% above the national average. Kiplinger says the average home price in its C2ER profile is about $1.35 million and average rent is $3,739 a month.
Zillow’s February 2026 average home value for San Francisco came in at $1,299,230, up 4.0% from a year earlier, which suggests the city’s market has regained some momentum after a stretch of softer performance.
San Francisco’s place on the list has never been about housing alone, though housing is still the main event. Groceries, utilities, transportation, and health care all run well above the national norm.
Tech wealth still matters here, but so do limited housing supply, local regulation, high service costs, and a market where even moderate improvements in demand can move prices quickly. San Francisco may feel less overheated than it once did, but affordable is nowhere in sight.
6. Brooklyn, New York
Brooklyn comes in sixth, with a cost of living 59.4% above the U.S. average. Kiplinger says housing-related expenses there are nearly four times the national average, which helps explain why Brooklyn is no longer viewed as the cheaper fallback for people priced out of Manhattan.
Zillow’s February 2026 average home value for Kings County was $927,317, up 5.1% year over year.
What makes Brooklyn especially hard for residents is the mismatch between cost and income. Kiplinger reports median household income at $76,912, below the national median used in its comparison.
In other words, housing and daily life carry a luxury-market price tag without a matching luxury-market income for much of the borough. That gap is a big reason Brooklyn feels expensive in a more punishing way than some high-income tech hubs do.
7. Queens, New York
View this post on Instagram
Queens ranks seventh at 50.6% above the national average. Compared with Manhattan and Brooklyn, its housing costs look a little less extreme, but only by comparison.
Kiplinger says housing in Queens still runs 152.2% above the national average, with average home prices close to $1.36 million and average monthly rent at $3,937. Zillow’s February 2026 average home value for Queens County was $739,475, up 5.1% from a year earlier.
Queens is one of the strongest reminders that “slightly cheaper than Manhattan” does not mean genuinely affordable. Households may get more space and a different neighborhood feel, but the overall cost picture remains steep.
Transportation access, airport-adjacent employment, a huge renter base, and steady housing demand keep pressure high. A household looking for relief inside New York City can find it in degrees, not in dramatic breaks.
8. Los Angeles, California
Los Angeles ranks eighth, with costs 49.4% above the national average. Kiplinger says housing-related expenses are 131.5% above the U.S. average, with average home prices around $1.35 million and average rent at $3,011 a month.
Zillow’s February 2026 average home value for Los Angeles city was $941,985, down 1.9% from a year earlier, while Los Angeles County averaged $878,851. Even with some cooling, pricing stays elevated enough to keep L.A. firmly in the top 10.
The classic L.A. cost story goes beyond housing. Transportation is expensive because car ownership and long commutes are woven into the metro’s structure.
Local taxes, insurance, and service prices also add weight to the monthly budget. A huge labor market and global cultural pull keep demand strong, but median income lags behind several other ultra-expensive metros. For many residents, Los Angeles feels costly in almost every direction at once.
9. San Diego, California
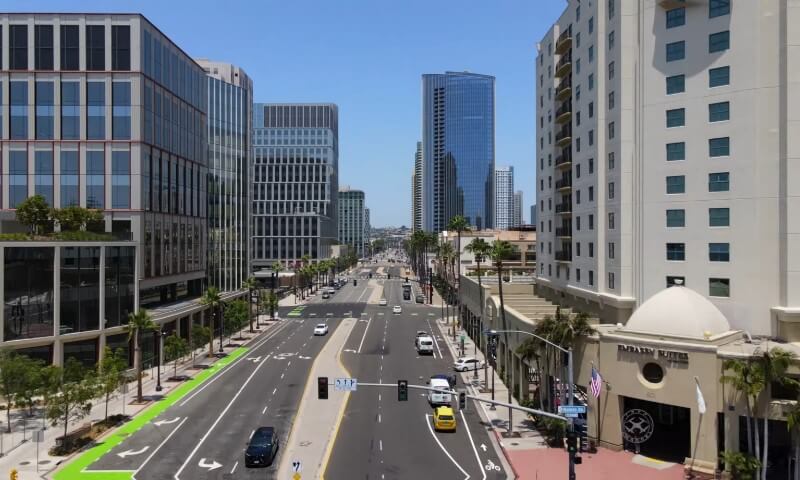
San Diego lands ninth, with a cost of living 46.1% above the national average. Kiplinger says average home prices in its C2ER profile are above $1.16 million, while average apartment rent is $3,132 a month.
Zillow’s February 2026 average home value was $989,768, down 3.4% from a year earlier. Price softening, then, has not been enough to remove San Diego from the upper tier of expensive U.S. markets.
San Diego often gets framed as a more relaxed Southern California option, and in lifestyle terms that can be true. In budget terms, the city remains punishing.
Weather, coast, strong demand, and limited supply keep housing expensive, while daily living costs follow along. A buyer may see a touch more negotiating room than during the market’s hottest stretch, but entry costs still sit near a million dollars on Zillow’s current measure.
10. Boston, Massachusetts
Boston rounds out the top 10, with living costs 44.8% above the national average. Kiplinger says housing costs run 114.3% above the national norm, with average apartment rent at $4,157 a month and average home prices just over $1.06 million in its C2ER-based profile.
Zillow’s February 2026 average home value for Boston was $768,702, down 0.4% from a year earlier.
Boston’s pricing reflects a different mix than California’s coastal giants. Higher education, biotech, hospitals, finance, and old housing stock create a market where demand stays resilient and supply remains tight.
Students, young professionals, researchers, and high-income households all compete in a city with limited room to expand. Boston may rank last in the top 10, but nothing about the rent or home-value picture feels modest.
Why Living Costs Stay So High in 2026
National inflation has cooled a lot from the peaks Americans saw a few years ago, but shelter still carries outsized weight in household budgets.
The Bureau of Labor Statistics said shelter was the largest factor in February 2026’s monthly CPI increase, and shelter costs were still up 3.0% over the prior 12 months.
At the same time, Reuters reported that economists expect U.S. home prices to rise only modestly in 2026 while 30-year mortgage rates stay near 6%, which keeps ownership expensive even in markets where price growth has slowed.
Zillow’s March outlook also points to soft rent growth nationally, though that softer picture does not erase the huge base level in the country’s priciest coastal markets.
In plain terms, cost pressure in the most expensive cities no longer comes from one source alone. Housing still does most of the damage, but insurance, groceries, utilities, commuting, and local service prices keep the pressure on.
In several cities on the list, buyers may see slightly cooler home values than a year ago, yet entry prices remain far above what most households can handle without a very high income.
A Few Patterns Worth Noticing
California dominates the list with five entries: San Jose, Orange County, San Francisco, Los Angeles, and San Diego. New York contributes three more if you count Manhattan, Brooklyn, and Queens separately.
That concentration says a lot about where housing scarcity, high wages, strong demand, and entrenched economic prestige still collide most intensely.
Another pattern stands out, too. Expensive cities do not all share the same income profile. San Jose and San Francisco pair huge costs with very high household incomes.
FAQs
Final Thoughts
America’s most expensive cities in 2026 are still concentrated on the coasts, still shaped by housing scarcity, and still difficult to crack without a large income or significant wealth. Some markets have cooled a bit.
Very few have become cheap. For renters, buyers, and families trying to plan a move, that is probably the main takeaway: relief exists mostly at the margins, while the biggest-cost cities remain very expensive by any normal standard.